2017 Goals: (Better Late Than Never) Mid-Year Check In

In January, I posted nine goals and it's time to do a mid-year check in to find out where that I need to focus on getting my bootie in gear!

1. Run a 100 mile race -- Done June 2017. Bryce 100M is in the books!

2. Run 2,400 miles / Climb 450,000 feet -- In progress / on track. Stats mid-July = 1,300 miles (54%) / 244,000 ft. (58%)

3. Conquer the hills -- Needs work! (A lot of work)!  The goal was to PR on the following:
(1) Marincello: Goal = beat 15:41 total or 10:53/mi -- best so far = 16:36 total or 11:31/mi
(2) Bobcat: Goal = beat 21:33 total or 10:39/mi -- best so far = 23:19 total or 11:31/mi
(3) Regular 12: Goal = beat 1:45:00 total or 9:03/mi -- best so far = 1:57:51 total or 10:09/mi

4. Read 52 books (with at least 4  of them off my home shelf) --  Done June 2017. Stats mid-June = 57 books. Also, as of mid-June, 6 of them have been off of my own shelf and I have given away 4 of them after I have finished them.

5. Bike or Run Commute once a week to work -- In progress / probably on track. The rain finally stopped, but then I got a flat tire and then I got lazy. I need a total of 180 biking miles (1 round trip per week = approx 3.5 miles). Stats mid-July = 35.4 miles (19% done). I have not run commute even once this year.

6. Try 12 new things -- In progress / probably on track. This can be a new place, a new food, a new activity, or...whatever! I have definitely added a few to my list but need to keep finding new things to try!

7. Spend less money than last year -- In progress / on track. As of the end of Q2, I have spent 26% less than last year. However, I did buy a car last year in March, so it's not surprising that the first two quarters this year are lower. It will be interesting to see how this shakes out after Q3, as I bought a lot of new backpacking gear this quarter.

8. Complete my yard project -- In progress / probably on track. In the front, I have done about 90% of the project. I still need to finalize the drip system and add rocks to one grassy area, but I am waiting for it to dry up first.

9. Complete my wall art / photo project -- In progress / probably on track. I did finally put up some photos! However, this is only about 75% done. I have to pick out a few larger photos to print and then hang them, which is something I tend to put off!

So I am done with two, on track with two, probably on track with four and need serious work on one!

How are your 2017 goals coming along? Have you spent more or less money than last year?

Wind River Range -- Part Two -- Logistics

Planning a week long hiking trip is fun, if you are an excel nerd, or maybe a chemist, or an outdoor enthusiast. Okay, never mind, it is actually fun no matter what! For me, planning is part of the package that makes up the perfect gift, a trip of a lifetime. I am not going to go into that here; you will be able to read more about that in part three, the trip report. For now, I will just say that the work that goes into something, be it the planning or the hiking or the sweat and the tears, or the cold nights and long days, makes the reward all that much more sweet.

The Plan: So the first thing I had to do was figure out where I wanted to go. I had been wanting to hike the Sierra High Route (SHR), which is an off trail route in the Sierras, for some time. However, it is about 200 miles long and at my estimate, I could hike about 20 miles per day, which would put me at 10 days, or too many days to do the trip on a one week vacation. So I looked for other options and found the Wind River High Route (WRHR), which is in the Wind River Range of Wyoming, very close to Jackson, Yellowstone and the Tetons. However, I will admit, I had never heard of this section of the Rockies before. However, this route, which was also off trail, was closer to 100 miles, which I figured I could do in one week. So, I invited my ultrarunning friend Dr. G and the planning began.

The Route: We used the Andrew Skurka guide, along with CalTopo maps and the app "Offline Maps" which has USGS topo maps that you can download to use offline. Skurka gives you a few GPS way points but the route is not mapped out for you. Dr. G loaded the waypoints into the Offline Maps as well. We also had a compass and paper topographical maps.

The Big Three: Next, it was time to get my gear list together. Luckily, I have a skeleton list already made out for other trips, so that part was not too much reinventing the wheel. However, this time, I wanted to finally buy some of those elusive lightweight items that had been on my wish list for so long. The main one was a sleeping bag. They say that there is a "big three" of hiking: the sleeping bag, the sleeping pad and the tent. These items, aside from food, are generally the heaviest in your pack. I had been shopping around for a lightweight but not super expensive sleeping bag for years and had even bought one once which turned out to not be warm enough. This time I bit the bullet and spent a little more in the hopes that this time I would have the sleeping bag of my dreams (see how I did that?)

I bought the following and will likely review them at some point: Western Mountaineering Ultralite 20 degree sleeping bag (29 oz), Hyperlite 2400 Southwest Backpack (28.6 oz), and the Therm-a-Rest NeoAir Xlite Small size (8 oz). Dr. G carried a two man tent, which weighed about 2 lbs (32 oz). Therefore, my big three + my backpack only weighed about 4 lbs, or if you include the weight I carried to compensate for not carrying the tent, it was about 5 lbs. To put it in perspective, my old backpack, which I love and have used a lot, weighs about 5.5 lbs empty. Yes, I said empty!

The Clothing: For clothing, my plan was to wear the following: running shorts, short sleeved running shirt, underwear, bra, socks and Saucony trail running shoes (Nomad). I would carry the following: Mountain Hardware windbreaker, long sleeved running shirt, Montbell rain jacket, rain pants, beanie, buff, gloves, MH down jacket, sleeping shirt (long sleeved), NorthFace tights, extra underwear, socks & bra. All of the clothing I carried (not counting clothing worn) weighed about 39 oz or 2.5 lbs.

The Other Stuff: I also had to bring toiletries, kitchen items (pot, pan, spoon, bowl, fuel, matches etc.), first aid, dry bags, water purifier, electronics (phone, charger, headlamp, camera etc.) and other utility items (knife, rope, compass, trash bag, whistle etc.). All together these weighed about 4 lbs.

Base Pack Weight: This is all things, excluding consumables, which include food, water and fuel. My goal was to keep this weight under 20 lbs, as I estimated food would be about 1.7 lbs per day x 6 days, which would be about 10 lbs, and I wanted to keep my pack under 30 total lbs. My total base weight ended up being about 11.5 lbs!! I was very excited about this.

The Food: This was the most fun but definitely the most time consuming portion of the planning. Oh my, I just said "portion." Ha. Seriously though, the goal is to carry the most amount of calories in the least amount of weight. We planned to try to have approximately 3,000 calories per day worth of food, which would hopefully be no more than 1.7 lbs per day. This sounds easy, right? You just load up your pack with Top Ramen and PowerBars, right? Nah. My goal was to have food that: (1) is nutritious, (2) tastes good, (3) is inexpensive (no $8 Mountain House meals), (4) can just have hot water added to it to cook and that (5) has some variety.

So I did a lot of weighing and calorie counting and math and came up with this food plan: Breakfast consisted of either muesli or oatmeal with milk, nuts and freeze dried fruit. Both were about 700 calories. There would also be coffee, with powdered milk and sugar, which would be about 80 - 100 calories. Lunch and snacks would consist of various nuts, bars, jerky, and dried fruit and would consist of about 1,200 - 1,600 calories per day. Dinner would consist of a curried top ramen dish, a mashed potato with bacon dish or a rice and beans dish, each clocking in at a little over 700 calories. I also brought olive oil to supplement, which is about 100 calories per serving. All in all, the goal was about 2,600 - 3,000 calories per day.

The H2O: I brought a 1.5L bladder and a 0.5L soft flask for water. Each liter of water weighs about 2 lbs, but my plan was to try to carry the least amount possible and fill up frequently, so as to keep the pack weight down.

Total Pack Weight: My food ended up being about 1.4 lbs per day. This, plus an estimated liter of water, would bring my total starting pack weight to about 23 total lbs. HOWEVER...Dr. G carried the tent and I carried some of his food, which brought my total up by about 4.5 lbs bringing my actual starting pack weight to 27.5 lbs.

The Verdict: This is the lightest I have ever been when doing a multi day backpacking trip. I lugged over 40 lbs up Mt. Whitney for a one night trip. I will (hopefully) never have to do that again. The pack felt comfortable and even when climbing up a steep rock or going through a tight squeeze, it was not too cumbersome.

A couple of things I would probably leave behind: the olive oil (it leaked plus we never used it), the all purpose soap (I did not shower, bathe, or use soap to do dishes or clean clothes like I thought I might), my sleeping shirt (I slept in my hiking clothes, although it is nice to have a possible dry shirt if needed), sports bra (I wore one and brought a spare and ended up wearing neither in the end) and my just-in-case tank top (it was never warm enough).

A couple of things I might bring some of / more of: gauze (I had tape but no gauze and I got a pretty big scrape which could have used a bit bigger of a cover), socks (I brought one spare but having wet feet is a pain), a different water carrying system (more on that in the trip report) and a different/newer charger (my solar charger is old and ran out of juice fast, plus it was not sunny so I could not recharge it).

A couple of things I could not have lived without: this Picaridin bug lotion (NO bug bites when applied, even with mosquitoes SWARMING), Advil, Neosporin / Bandaids / Leukotape (as mentioned above, I got a scrape and it was nice to have something to clean it), earplugs (my tentmate was a snorer, plus the sleeping pads are loud) my new sleeping bag (fabulous! We spent one night in a snowstorm and I was not cold at all), maps/compass/GPS (after all, this was an off trail trek), Garmin 910ST, camera (I took about 800 photos), Yaktrax (I almost left them behind), and nuts (fat, protein and carbs all rolled into one, which keeps you feeling more full throughout the day).

In the end, I ate every speck of my food, except for the olive oil and one packet of Justin's Peanut Butter. I also used everything in my bag, except for the few things mentioned above and any emergency items (rope, knife, first aid). There was nothing that I really missed or really felt was dead weight. I felt that the packing ended up being pretty much perfect. I may try to compress a few things down a bit more with a compression sack so I can fit a little more if I am hiking for more days. I also need to figure out my water system and probably configure one extra pocket on the front of my pack (my pack has two hip pockets but no chest pocket). Otherwise, things are looking pretty good!

Have you ever planned for a long hiking or backpacking trip? Or maybe a long vacation? What is your logistical planning strategy?

Wind River Range -- Part One -- Trail Conditions

At the beginning of this month my friend Dr. G and I went hiking in the Wind River Range in Wyoming. It was hard for us to find online information regarding weather etc., so my trip report is going to consist of three parts: (1) Weather Report / Trail Conditions, (2) Logistics and (3) Trip Report. This way if anyone needs trail info, they will hopefully be able to find it here. If you are reading this and don't plan on hiking, you can skip part one and wait until part two or three come out! 

A taste of what's to come

I will go into this in more detail later, but most of our hike consisted of traveling on the semi-charted and very informal "Wind River High Route." (See here for the Skurka version or the Wilson/Dixon version) Described by Andrew Skurka as being approximately 66% off trail, it consisted of a lot of boulder hopping, stream fording, snowfield crossing, bushwhacking and route finding. This was a huge challenge as well as being a lot of fun. However, there were some things that it would have been nice to know beforehand. 

First and foremost, there was A LOT more snow than I expected. Most of the route is above 10,500 feet and much of it is even in the 12,000 foot plus range. I knew there would be some snow; I knew this year was more snowy than others have been. However, there was still even more snow that I expected even after taking certain factors into consideration. I brought Yaktrax and Dr. G had micro-spikes and we used them a lot! However, depending on your expertise, I would even say that some sections warranted crampons/ice axes or at least trekking poles, especially if you are inexperienced or faint at heart. 


Wilson/Dixon descending the south side of Alpine Lakes Pass in 2013 (source)

Dr. G ascending the south side of Alpine Lakes Pass Aug 2017

Dr. G ascending the south side of Alpine Lakes Pass Aug 2017 (he is the tiny speck beyond the tiny rock)

Foodwise, I ate ALL of my food. When the hike was done, I had one packet of peanut butter (180 calories) left over. I had eaten every other scrap of food that I brought. I will go into more detail about this in the logistics portion of this series, but basically my takeaway is that I forgot how much the altitude and constant movement can burn up those calories!

In addition, of the seven days we hiked, five of them had rain, hail or snow. One night, as we were camping at about 11,000 feet, we got snowed on and woke up to the sound of the snow sliding off the top of the tent to the ground. The next day there was a beautiful layer of new snow, which was priceless, but it was hard to see the rocks underneath to see where to step or to determine where the best path was. Needless to say, I wore pretty much everything that I brought, even the "just in case" layers, and I was mighty glad to have bought a new sleeping bag before setting out. Also, if you do not have a waterproof backpack, I suggest dry bags or at the very least a trash bag pack liner. 

Rainy but never gloomy!

New snow! Beautiful but hard to get traction! Looking north from Europe peak.

Due to the above and probably other things such as route finding errors and variability of the route in general, the hike took us a lot longer than expected. The total route is supposed to be 96 miles, so we thought it realistic that we would take five or maybe six days to complete the route. However, due to a few wrong turns and snowy days, it took us seven days, we only averaged about 15 miles per day AND ended up with a total route distance of 114 miles. 

If you have any questions, I am happy to answer them! 

For my normal readers, have you ever gone off trail when hiking? Have you ever heard of the Wind River Range?

Temperature Rise


How much could temperatures rise by 2026? The above image shows how a rise of 10°C (18°F) could occur by the year 2026, based on temperature anomalies from 1750 for February and on progressive growth of warming elements. The image below shows the same rise in another way.


Such a rise could take place even more rapidly, as discussed in the earlier post 10°C or 18°F warmer by 2021? For more on calculating the temperature rise from 1750 to 2016, see this page and this post.


Crucial will be the decline of snow & sea ice and associated feedbacks. Ominously, global sea ice is at a record low at the moment, as illustrated by the graph below by Wipneus.


[ click on images to enlarge ]
Arctic sea ice extent on August 15, 2017, was the 2nd lowest on record for the time of year (behind only 2012), as illustrated by the image on the right.

While extent was lower on August 15, 2012, Arctic sea ice is very thin at the moment, as the Arctic Ocean has become warmer, and sea ice could disappear altogether in one month time, as discussed in earlier posts such as this one.

And ominously, July 2017 was the hottest July on record, as illustrated by the image below.


[ click on images to enlarge ]
The July temperature anomaly was particularly high on land on the Southern Hemisphere (1.53°C or 2.75°F, compared to 1901-2000), as illustrated by the image on the right, showing a linear trend over the period 2012-2017.

Above image shows that July 2017 was 2.25°C (4.05°F) warmer than the annual global mean 1980-2015 (seasonal cycle). Only in August 2016 was it warmer (2.29°C), but then again, August 2017 looks set to be warmer than that yet.

The fall in thickness of the sea ice indicates that the buffer has gone that until now has consumed heat entering the Arctic Ocean during the melting season. In the absence of this buffer, where can all this extra heat go? Sea ice will start sealing off much of the surface of the Arctic Ocean by the end of September 2017, making it hard for more heat to escape from the Arctic Ocean by entering the atmosphere.

The Buffer has gone, feedback #14 on the Feedbacks page
The danger is that much of the extra heat will instead reach sediments at the seafloor of the Arctic Ocean that contain huge amounts of methane in currently still frozen hydrates.

[ click on images to enlarge ]
Higher temperatures could destabilize methane hydrates, resulting in huge methane eruptions.

A polynomial trend, based on NOAA July 1983 to January 2017 global monthly mean methane data, points at twice as much methane by 2034, as the image on the right shows. Stronger methane releases from the seafloor could make such a doubling occur even earlier. Over the next decade, methane will cause more warming than CO₂  twice as much methane will cause more than twice as much warming.

Methane reached peaks as high as 2881 ppb at 479 mb on August 18, 2017, as the combination image below shows (left panel, top left corner).
[ click on images to enlarge ]
The image doesn't specify the origin of the peak, but when levels are that much above the mean, the likely cause is either wildfires or clathrate destabilization. As the image in the right panel shows, methane levels at 280 mb were also very high over the Arctic Ocean north of Canada in the morning that day, which is unusual at such an altitude.

The image below shows that mean global methane reached a level of 1881 ppb at 280 mb (MetOp-1, am) on August 15, 2017.


The situation is dire and calls for comprehensive and effective action, as described at the Climate Plan.


Links

• Climate Plan
https://arctic-news.blogspot.com/p/climateplan.html

• Extinction
https://arctic-news.blogspot.com/p/extinction.html

• Temperature rise from 1750 to 2016
https://arctic-news.blogspot.com/p/temperature.html

• How much warming have humans caused?
https://arctic-news.blogspot.com/2016/05/how-much-warming-have-humans-caused.html

• Feedbacks
https://arctic-news.blogspot.com/p/feedbacks.html

• How much warming have humans caused?
https://arctic-news.blogspot.com/2016/05/how-much-warming-have-humans-caused.html

• 10°C or 18°F warmer by 2021?
https://arctic-news.blogspot.com/2017/04/10c-or-18f-warmer-by-2021.html

• Arctic Sea Ice Break Up August 2017
https://arctic-news.blogspot.com/2017/08/arctic-sea-ice-break-up-august-2017.html


Arctic Sea Ice Break Up August 2017

Sun at 8:00 am, captured by Jim Reeve on August 7, 2017 near Sechelt AirPort, B.C., Canada
Arctic sea ice is under attack from all sides.  At this time of year, the sun doesn't set at the higher latitudes.

As the image below shows, it was as hot as 94°F or 34.5°C in North Canada on August 13, 2017 (at the green circle, at 1000 hPa, at 00:00 UTC). Temperatures at surface level were as high as 33.1°C or 91.5°F at that location, where wind was coming from the south and blowing toward the north at a speed of 28 km/h or 17 mph at that time.


Above image shows cyclonic winds over the Arctic Ocean pulling warm air from North Canada over the Arctic Ocean, while pushing cold air out. Winds and rain have been battering the sea ice for some time now, as discussed in an earlier post.

Fires are becoming more devastating, as discussed in an earlier post. The August 2, 2017, satellite image below shows smoke from fires in British Columbia blanketing Vancouver and Seattle. Carbon dioxide (CO₂) levels were as high as 527 ppm, carbon monoxide (CO) levels as high as 12.59 ppm and sulfur dioxide (SO₂) levels as high as 490.77 µg/m³, as these images show.  


The combination image below shows forecasts for August 8, 2017, 13:30 UTC. CO levels were forecast to be as high as 29.05 ppm, CO₂ levels as high as 625 ppm and SO₂ levels as high as 1089.65 µg/m³ (each time at the green circle). Also note the emissions from forest fires in Siberia.


Actual levels were even higher at that spot on August 11, 2017, when CO was as high as 30.97 ppm, CO₂ was as high as 633 ppm and SO₂ was as high as 1150.19 µg/m³, as illustrated by the image below.

[ click on images to enlarge ]
The image below, by Harold Hensel, shows smoke over British Columbia, Washington, and Montana on August 9, 2017.


Winds can carry smoke from forest fires over long distances, all the way to the Arctic sea ice, where the soot can settle and darken the ice, thus speeding up its decline. The image below, also by Harold Hensel, shows smoke from fires in Russia entering the Arctic Ocean near the Laptev Sea on August 9, 2017. 


The image below shows the situation on August 14, 2017.


Canadian wildfires caused PM10 to reach levels as high as 11,599 μg/m³ on August 16, 2017, at the location marked by the green circle. The image below shows PM10 getting blown over the Arctic Ocean.


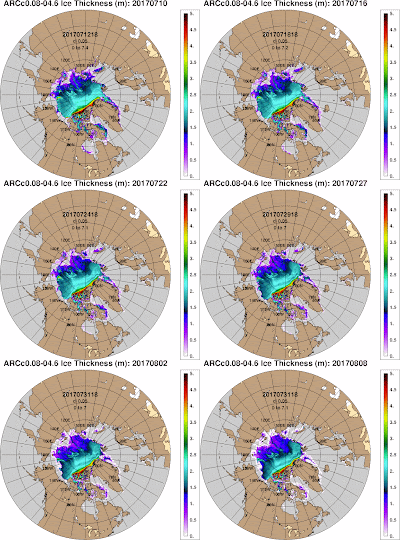
The thickest sea ice in the Arctic Ocean is located close to the north of Greenland and the Canadian Archipelago. This ice is now breaking up, due to high temperatures and strong cyclonic winds that cause warm rain, high waves and strong sea currents.

Watch the thickest sea ice break up on the animation below. This is a 17 MB file, so it may take some time to fully load. Click here if you do not see the file appear below.

The animation below shows the thickest sea ice breaking up between July 14, 2017, and August 13, 2017. 

[ click on image to enlarge ]

The situation is dire and calls for comprehensive and effective action, as described at the Climate Plan.


Arctic sea ice may well be gone by September 2017

The Arctic Ocean is warming up fast and this is melting the sea ice from below.

Sea surface temperature anomalies are well above 8°C (14.4°F) in several parts of the Arctic Ocean.

The image on the right shows sea surface temperature anomalies from 1961-1990 for the Arctic (60°N - 90°N) on August 2, 2017.

Global sea ice extent is at a record low for the time of the year, as illustrated by the graph below, by Wipneus. Lower sea ice extent means that less sunlight is reflected back into space.


Arctic sea ice extent in 2017 is shrinking along a path that currently looks similar to the years 2012, 2016 and 2007, when sea ice reached 1st, 2nd and 3rd place, respectively, regarding lowest extent (image right).

Arctic sea ice volume has been at record low since the start of 2017 and is currently similar to 2012, as illustrated by the graph below right, by Wipneus (click on images to enlarge them).

Arctic sea ice may look to be similar to what it was in 2012, when extent and volume reached lowest since satellite measurements began.

However, sea ice thickness has fallen dramatically over the years in the areas where previously was the thickest ice.

This is illustrated by the combination image below, showing Arctic sea ice thickness (in m) in July 31, 2012 (left panel) versus thickness on July 31, 2017 (right panel).

[ click to enlarge ]
The navy.mil animation on the right shows sea ice getting thinner recently, with especially the thicker sea ice disappearing fast.

There appear to be discrepancies between the PIOMASS calculation of ice volume and the ice thickness images by navy.mil.
This may be due to the way volume is calculated and may be similar to differences in extent and area.

Sea ice clearly has disappeared most where once the thickest ice was present.


Harold Hensel points out that extent may at first glance show more ice but each cell in a grid may only have 15% of ice present to be labeled 'ice-covered'. Harold adds an image showing ice concentration, which gives another insight in the shape and condition of the sea ice (above image).

Paul Beckwith and Patrick McNulty bluntly conclude that PIOMAS is wrong, as illustrated by the Twitter screenshot on the right.

Clearly, dramatic shrinking of the thicker sea ice has occurred over the past few years and one of the reasons for this is the ever warmer water that is getting pushed into the Arctic Ocean along the Gulf Stream. This is melting the sea ice from below. Warming of the Arctic Ocean heats up the air over the Arctic Ocean, as illustrated by the image below.


[ click on image to enlarge ]
The above image shows a 365-day surface temperature anomaly. The change over time is also illustrated by the animation on the right.

On average, surface temperatures over the Arctic Ocean have been more than 2.5°C (or 4.5°F) warmer than in 1981-2010. The warmer air is now also melting the sea ice from above, as temperatures over the Arctic have risen to well above the freezing point.

High temperatures over the Arctic Ocean means that precipitation no longer takes the form of snow, but instead falls in the form of rain.


Below is a further warning, against a more recent background image (situation on August 6, 2017).


[ click on image to enlarge ]
High temperatures of the surface of the ocean combined with strong winds makes that a lot of moisture is rising from the sea surface to the atmosphere.

The image on the right shows that sea surface temperatures in the Bering Strait were as high as 19°C (or 66.2°F) on July 22, 2017. This is partly the result of warm water from rivers entering the Bering Strait.

Furthermore, cyclones can make winds reach high speeds, as illustrated by the image below, showing Typhoon Noru approaching Japan.

The image shows a forecast for August 5, 2017, 18:00 UTC. Waves have been forecast to be as high as 16.15 m or 53 ft, while winds have been forecast to be as fast as 214 km/h or 133 mph or 116 kn.

[ click on image to enlarge ]
Total precipitable water has been forecast to be as much as 91.000 kg/m² and 3-hr Precipitation Accumulation has been forecast to be as much as 281.3 mm (or 281.3 kg/m²) or 11.07 in.

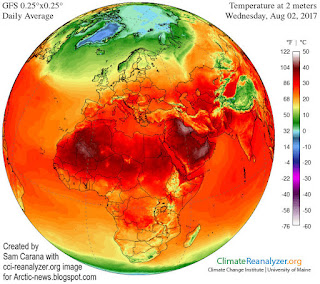
Back to the Arctic, where strong winds and moist air combine to make a lot of rain, as temperatures are well above freezing in most areas, as illustrated by the image on the right (showing air temperature at 2 m).

The image below shows how strong winds are pushing warm and moist air through the Bering Strait on July 31, 2017 at surface level (left), at 700 hPa (center) and at 250 hPa (right), where the jet stream used to separate the cold air in the Arctic from the warmer air further south.


As above image also shows, the jet stream is getting more and more out of shape, at places crossing the Arctic Ocean. In the video below, Paul Beckwith discusses the situation in the Arctic.


The image below shows trends for both Arctic and Antarctic sea ice area pointing downward.


When looking at sea ice volume, zero sea ice in September 2017 is within the margins of the trendline below on the right.

[ Arctic sea ice, gone by Sept. 2017? ]
Given the speed at which many feedbacks can kick in and the interaction between warming elements, Arctic sea ice volume may well be gone by September 2017.

The low sea ice volume means that there is very little sea ice left to act as a buffer this year. Therefore, a huge amount of heat will not be able to be consumed this year in the process of melting ice and will instead speed up warming of water of the Arctic Ocean.

Less sea ice additionally means that less sunlight will be reflected back into space, and this heat will instead further speed up Arctic warming.

The Buffer has gone, feedback #14 on the Feedbacks page

Where can all this extra heat go? Sea ice is expected to start sealing off much of the surface of the Arctic Ocean by the end of September 2017, which will make it harder for heat to escape the Arctic Ocean by entering the atmosphere.

The danger is that much of the extra heat will instead reach sediments at the seafloor of the Arctic Ocean that contain huge amounts of methane in currently still frozen hydrates.

The image on the right shows that methane reached levels as high as 2583 ppb on July 31, 2017.

The image also shows high methane levels over Antarctica where hydrate destabilization also appears to be taking place, as discussed in an earlier post.

The situation is dire and calls for comprehensive and effective action, as described at the Climate Plan.


Links

• Climate Plan
https://arctic-news.blogspot.com/p/climateplan.html

• 10°C or 18°F warmer by 2021?
https://arctic-news.blogspot.com/2017/04/10c-or-18f-warmer-by-2021.html

• Abrupt Warming - How Much And How Fast?
https://arctic-news.blogspot.com/2017/05/abrupt-warming-how-much-and-how-fast.html

• Accelerating growth in CO₂ levels in the atmosphere
https://arctic-news.blogspot.com/2017/02/accelerating-growth-in-co2-levels-in-the-atmosphere.html

• Feedbacks
https://arctic-news.blogspot.com/p/feedbacks.html

• Extinction
https://arctic-news.blogspot.com/p/extinction.html

• Methane Erupting From Arctic Ocean Seafloor
https://arctic-news.blogspot.com/2017/03/methane-erupting-from-arctic-ocean-seafloor.html

• Warning of mass extinction of species, including humans, within one decade
https://arctic-news.blogspot.com/2017/02/warning-of-mass-extinction-of-species-including-humans-within-one-decade.html


Looking Back: July

“Warm, mellow summer. The glowing sunbeams make every nerve tingle. The new needles of the pines and fir are nearly full grown and shine gloriously.”  - John Muir

Running: I had a couple of pretty substantial weeks of running, bringing the total in July to 238 miles and about 40,800 feet of climbing. In addition, I am finally getting back on the bike, and logged about 65 miles this month. Last month, I also did about 20 miles. My goal was to ride to work once a week, which is about 5 miles. However, for the first half of the year, I basically did not ride at all. So now I have to maintain an average of about 10 miles per week or 40 miles a month, which I am on track to do if I keep it up!

I have also been doing yoga 1 - 2 times per week (this one). The yoga and the biking are definitely making my legs more heavy when I run, but I think that's mostly because this is the first month of doing all of it together. Hopefully my body will get accustomed to all the different activities and it will be stronger rather than more tired!

Reading: In July, I did a lot of driving and quite a few solo runs and bike rides. What this ended up translating to was more "reading" in the form of audiobooks! I read a total of 11 books, 5 of which were audiobooks (in italics). There were some pretty good ones. I have listed them below in order of preference (with books from my own shelf in bold). I have noticed one thing: my liking an audiobook can depend a lot on whether or not I like the narrator, which isn't really fair to the author. Also, I tend to not pay as much attention when I am listening to a book versus reading it myself, especially since usually I am driving or doing something else at the same time rather than focusing only on the book. However, it is a great way to get two times as many books read!

My First Summer in the Sierra***** (see review here)
These is My Words: The Diary of Sarah Agnes Prine 1881 - 1901****
Everything You Want Me To Be****
Missoula: Rape and the Justice System in a College Town****
The Mothers***
Silver Bay***
Everything, Everything***
By The River Piedra I Sat Down and Wept***
The Reason For God**
Fortune's Rocks**
My Brilliant Friend**

Travel: What a great month! I actually had a couple of weekends at home, which is very odd for a July, but I am not complaining! I got to finally do some things around the house, as well as prepping for my next trip, which is in August. However, I did spend some time in Oregon, as I always do in July, and I also went on a camping trip to Mammoth, which was a little different than expected due to the heavy amount of snow in the Sierras this year. Let's just say that running was superseded by slip-sliding, hiking and route finding and the camp site that we wanted was still located on a closed road. It was still a lot of fun and the high Sierras were beautiful covered in snow and ice.

Thousand Island Lake, CA

Emerald Lake, CA

Garnet Lake, CA

Garnet Lake, CA

Shadow Lake, CA

Devils Postpile, CA

Smith Rock State Park, OR

Mt. Washington, OR


Etc.: So far in the garden there are some ripe tomatoes and a few cucumbers, but I think that a rat is eating my zucchini as I keep finding chewed nubs. Darn it, varmit. So I am just starting to be able to have tomato salads and to have a once in a while cucumber snack. I also had some potatoes that were sprouting eyes, so I planted them last week for a "fall planting." We shall see if they take! And the corn is growing! No ears yet, but it's getting taller!


Corn (on the left), end of July. Tomatoes in the background on the right.

Where did you go in July? What is your favorite summer read so far? Do you have anything fun planned for the rest of the summer?
Designed with by Way2themes | Distributed by Blogspot Themes