Global biodiversity collapse
A recent study created a dataset of plant temperature tolerances with a median upper tolerance limit of 23.7°C.
This temperature is about 10°C higher than the temperature in the year 1750.
Only during times of mass extinctions were temperatures that high, such as during the PETM, 55.5 million years ago, and the Permian–Triassic extinction event, 252 million years ago, also know as the Great Dying when some 95% of species known from fossils went extinct.
The study concludes that extinction will already occur far earlier than when upper tolerance levels are reached, as "loss of one species can make more species disappear (a process known as ‘co-extinction’), and possibly bring entire systems to an unexpected, sudden regime shift, or even total collapse."
There was a small group of species with large tolerance limits and remarkable resistance to environmental change, but even they could not survive co-extinctions. In fact, their extinction was abrupt and happened far from their tolerance limits and close to global biodiversity collapse at around 5°C of heating.
In the top image on the right, monthly NASA Land+Ocean temperature data 2017-October 2018 are adjusted, and a polynomial trend is added, showing how a 5°C rise in temperature could occur very rapidly, i.e. by September 2019.
The second image on the right is from an earlier post that contains more background on the adjustment of NASA data and the need for a polynomial trend.
A strong abrupt rise in temperature could be caused by an influx of warm salty water into the Arctic Ocean, as this can trigger large eruptions of methane from its seafloor, as discussed in earlier posts such as this one and as further discussed below.
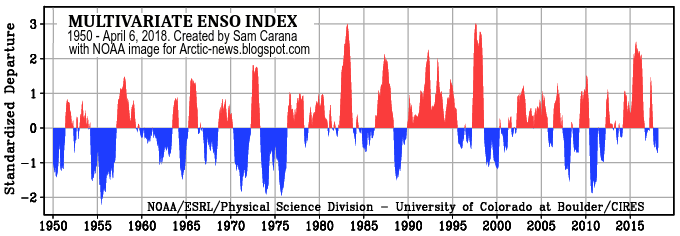
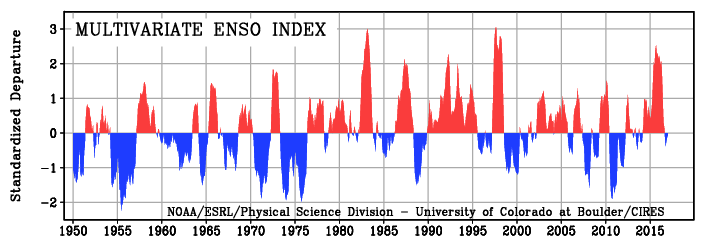
As El Niño sets in, the odds that such rapid warming will threaten to cause global biodiversity collapse are rising.
Earthquakes triggering methane releases

 An additional danger is that large methane releases from the seafloor of the Arctic Ocean will be triggered by earthquakes.
The danger is that isostatic rebound will trigger earthquakes in the Arctic Ocean that this in turn will destabilize methane hydrates, as discussed in more detail at this page.

Seismic shocks can travel over long distances along fault lines and destabilize methane hydrates in other locations.
 Above image shows that on November 9, 2018, an earthquake with a magnitude of 6.8 on the Richter scale occurred on the fault line between Greenland and Norway.
This area is not used to be hit by large earthquakes. No larger earthquake has occurred in this area for more than 100 years.
Subsequent earthquakes did occur nearby, on November 12, 13 and 15, respectively measuring M4.3, M4.6 and M5.2 on the Richter scale, which also are very large earthquakes to hit this area.
Ominously, high levels of methane showed up on November 21, 2018, over the Greenland Sea (top image on the right).

Earlier, high levels of methane had been recorded over the Arctic Ocean. Note that this fault line runs across the Arctic Ocean toward the Laptev Sea.
Methane levels as high as 2787 ppb were recorded on November 15, 2018 (second image on the right).
On November 17, 2018, methane levels as high as 2847 ppb were recorded (third image on the right).
On November 20, 2018, methane levels as high as 2827 ppb were recorded (fourth image on the right).
The images show large methane levels over the East Siberian Arctic Shelf, the submarine permafrost north of Eastern Siberia.
In a 2008 paper, Dr. Natalia Shakhova et al. concluded that release of up to 50 Gt of methane from hydrates storage could occur at any time, an amount many times the methane that is now present in the atmosphere.
Additional emissions
 Such a temperature rise would trigger many forest fires, releasing huge amounts of additional emissions, including carbon dioxide, methane and black carbon.
The image on the right shows carbon dioxide levels in California as high as 809 ppm on November 10, 2018 (at the green circle).
The next image on the right illustrates the jump in carbon dioxide levels in Mauna Loa, Hawaii, following the the fires in California.
“Levels of heat-trapping greenhouse gases in the atmosphere have reached another new record high,” the World Meteorological Organization (WMO) said in a recent news release. “There is no sign of a reversal in this trend, which is driving long-term climate change, sea level rise, ocean acidification and more extreme weather.”
 “The science is clear. Without rapid cuts in CO₂ and other greenhouse gases, climate change will have increasingly destructive and irreversible impacts on life on Earth. The window of opportunity for action is almost closed,” said WMO Secretary-General Petteri Taalas.
“The last time the Earth experienced a comparable concentration of CO₂ was 3-5 million years ago, when the temperature was 2-3°C warmer and sea level was 10-20 meters higher than now,” said Mr Taalas.
“CO₂ remains in the atmosphere for hundreds of years and in the oceans for even longer. There is currently no magic wand to remove all the excess CO₂ from the atmosphere,” said WMO Deputy Secretary-General Elena Manaenkova.
In the associated video, Dr Oksana Tarasova added that “changes in carbon dioxide levels that we are observing now do not happen naturally. Such changes never ever happened in the history of this Planet.”
As the image on the right shows, CH₄, CO₂ and N₂O levels in the atmosphere are, respectively, 257%, 146% and 122% their 1750 levels.
How fast could 5°C warming happen?
The U.S. Global Change Research Program has just released its Fourth National Climate Assessment. One of its key messages is that temperatures could rise by 5°C or more. The report adds that this could occur by the end of the century, but the report doesn't deny this could also occur much earlier. Indeed, one of its key findings is that some feedbacks and potential state shifts cannot be quantified; and some are probably still unknown.
What the report doesn't mention is that global biodiversity will have collapsed at 5°C of warming. Such a rise kills all plants on land and thus virtually all mammals (including humans), since they either directly or indirectly feed on plants.
A rapid 5°C rise could occur if an influx of warm salty water triggered methane eruptions from the seafloor of the Arctic Ocean. Combined with snow and ice loss, it could rapidly raise temperatures by 1.5°C, which increases water vapor. If cloud feedback is strongly positive, water vapor feedback can lead to 3.5 times as much warming, so these warming elements alone could cause 5°C warming within years. And then, of course, there are further warming elements.

The situation is dire and calls for comprehensive and effective action, as described at the Climate Plan, i.e. multiple lines of action implemented in parallel and locally where possible. Of course, as long as politicians remain reluctant to even consider pursuing efforts to reduce emissions, the world can be expected to remain in the Danger Zone for a long time to come.
Links
• Co-extinctions annihilate planetary life during extreme environmental change, by Giovanni Strona and Corey Bradshaw (2018)
https://www.nature.com/articles/s41598-018-35068-1
• Greenhouse gas levels in atmosphere reach new record, World Meteorological Organization (WMO)
https://public.wmo.int/en/media/press-release/greenhouse-gas-levels-atmosphere-reach-new-record
• WMO video - Press Conference: Greenhouse Gas Bulletin (Geneva, 22 November 2018)
http://webtv.un.org/watch/wmo-press-conference-greenhouse-gas-bulletin-geneva-22-november-2018/5970414543001/
• Fourth National Climate Assessment - U.S. Global Change Research Program
https://nca2018.globalchange.gov/
• Doomsday by 2021?
https://arctic-news.blogspot.com/2018/11/doomsday-by-2021.html
• Climate Plan
https://arctic-news.blogspot.com/p/climateplan.html
• Feedbacks
https://arctic-news.blogspot.com/p/feedbacks.html
• Extinction
https://arctic-news.blogspot.com/p/extinction.html
• Seismic Events
https://arctic-news.blogspot.com/p/seismic-events.html
• Can we weather the Danger Zone?
https://arctic-news.blogspot.com/2018/07/can-we-weather-the-danger-zone.html
• How much warmer is it now?
https://arctic-news.blogspot.com/2018/04/how-much-warmer-is-it-now.html
• What Does Runaway Warming Look Like?
https://arctic-news.blogspot.com/2018/10/what-does-runaway-warming-look-like.html
• Peaks Matter
https://arctic-news.blogspot.com/2018/08/peaks-matter.html
• Warning of mass extinction of species, including humans, within one decade
https://arctic-news.blogspot.com/2017/02/warning-of-mass-extinction-of-species-including-humans-within-one-decade.html
 |
| [ Will global biodiversity collapse in 2019? ] |
A recent study created a dataset of plant temperature tolerances with a median upper tolerance limit of 23.7°C.
This temperature is about 10°C higher than the temperature in the year 1750.
Only during times of mass extinctions were temperatures that high, such as during the PETM, 55.5 million years ago, and the Permian–Triassic extinction event, 252 million years ago, also know as the Great Dying when some 95% of species known from fossils went extinct.
 |
| [ image from: How much warmer is it now? ] |
There was a small group of species with large tolerance limits and remarkable resistance to environmental change, but even they could not survive co-extinctions. In fact, their extinction was abrupt and happened far from their tolerance limits and close to global biodiversity collapse at around 5°C of heating.
 |
| [ El Niño sets in ] |
The second image on the right is from an earlier post that contains more background on the adjustment of NASA data and the need for a polynomial trend.
A strong abrupt rise in temperature could be caused by an influx of warm salty water into the Arctic Ocean, as this can trigger large eruptions of methane from its seafloor, as discussed in earlier posts such as this one and as further discussed below.
As El Niño sets in, the odds that such rapid warming will threaten to cause global biodiversity collapse are rising.
Earthquakes triggering methane releases

 An additional danger is that large methane releases from the seafloor of the Arctic Ocean will be triggered by earthquakes.
The danger is that isostatic rebound will trigger earthquakes in the Arctic Ocean that this in turn will destabilize methane hydrates, as discussed in more detail at this page.

Seismic shocks can travel over long distances along fault lines and destabilize methane hydrates in other locations.
 Above image shows that on November 9, 2018, an earthquake with a magnitude of 6.8 on the Richter scale occurred on the fault line between Greenland and Norway.
This area is not used to be hit by large earthquakes. No larger earthquake has occurred in this area for more than 100 years.
Subsequent earthquakes did occur nearby, on November 12, 13 and 15, respectively measuring M4.3, M4.6 and M5.2 on the Richter scale, which also are very large earthquakes to hit this area.
Ominously, high levels of methane showed up on November 21, 2018, over the Greenland Sea (top image on the right).

Earlier, high levels of methane had been recorded over the Arctic Ocean. Note that this fault line runs across the Arctic Ocean toward the Laptev Sea.
Methane levels as high as 2787 ppb were recorded on November 15, 2018 (second image on the right).
On November 17, 2018, methane levels as high as 2847 ppb were recorded (third image on the right).
On November 20, 2018, methane levels as high as 2827 ppb were recorded (fourth image on the right).
The images show large methane levels over the East Siberian Arctic Shelf, the submarine permafrost north of Eastern Siberia.
In a 2008 paper, Dr. Natalia Shakhova et al. concluded that release of up to 50 Gt of methane from hydrates storage could occur at any time, an amount many times the methane that is now present in the atmosphere.
Additional emissions
 Such a temperature rise would trigger many forest fires, releasing huge amounts of additional emissions, including carbon dioxide, methane and black carbon.
 The image on the right shows carbon dioxide levels in California as high as 809 ppm on November 10, 2018 (at the green circle).

The next image on the right illustrates the jump in carbon dioxide levels in Mauna Loa, Hawaii, following the the fires in California.
“Levels of heat-trapping greenhouse gases in the atmosphere have reached another new record high,” the World Meteorological Organization (WMO) said in a recent news release. “There is no sign of a reversal in this trend, which is driving long-term climate change, sea level rise, ocean acidification and more extreme weather.”
 “The science is clear. Without rapid cuts in CO₂ and other greenhouse gases, climate change will have increasingly destructive and irreversible impacts on life on Earth. The window of opportunity for action is almost closed,” said WMO Secretary-General Petteri Taalas.
“The last time the Earth experienced a comparable concentration of CO₂ was 3-5 million years ago, when the temperature was 2-3°C warmer and sea level was 10-20 meters higher than now,” said Mr Taalas.
“CO₂ remains in the atmosphere for hundreds of years and in the oceans for even longer. There is currently no magic wand to remove all the excess CO₂ from the atmosphere,” said WMO Deputy Secretary-General Elena Manaenkova.
In the associated video, Dr Oksana Tarasova added that “changes in carbon dioxide levels that we are observing now do not happen naturally. Such changes never ever happened in the history of this Planet.”
As the image on the right shows, CH₄, CO₂ and N₂O levels in the atmosphere are, respectively, 257%, 146% and 122% their 1750 levels.
How fast could 5°C warming happen?
The U.S. Global Change Research Program has just released its Fourth National Climate Assessment. One of its key messages is that temperatures could rise by 5°C or more. The report adds that this could occur by the end of the century, but the report doesn't deny this could also occur much earlier. Indeed, one of its key findings is that some feedbacks and potential state shifts cannot be quantified; and some are probably still unknown.
What the report doesn't mention is that global biodiversity will have collapsed at 5°C of warming. Such a rise kills all plants on land and thus virtually all mammals (including humans), since they either directly or indirectly feed on plants.
A rapid 5°C rise could occur if an influx of warm salty water triggered methane eruptions from the seafloor of the Arctic Ocean. Combined with snow and ice loss, it could rapidly raise temperatures by 1.5°C, which increases water vapor. If cloud feedback is strongly positive, water vapor feedback can lead to 3.5 times as much warming, so these warming elements alone could cause 5°C warming within years. And then, of course, there are further warming elements.

The situation is dire and calls for comprehensive and effective action, as described at the Climate Plan, i.e. multiple lines of action implemented in parallel and locally where possible. Of course, as long as politicians remain reluctant to even consider pursuing efforts to reduce emissions, the world can be expected to remain in the Danger Zone for a long time to come.
Links
• Co-extinctions annihilate planetary life during extreme environmental change, by Giovanni Strona and Corey Bradshaw (2018)
https://www.nature.com/articles/s41598-018-35068-1
• Greenhouse gas levels in atmosphere reach new record, World Meteorological Organization (WMO)
https://public.wmo.int/en/media/press-release/greenhouse-gas-levels-atmosphere-reach-new-record
• WMO video - Press Conference: Greenhouse Gas Bulletin (Geneva, 22 November 2018)
http://webtv.un.org/watch/wmo-press-conference-greenhouse-gas-bulletin-geneva-22-november-2018/5970414543001/
• Fourth National Climate Assessment - U.S. Global Change Research Program
https://nca2018.globalchange.gov/
• Doomsday by 2021?
https://arctic-news.blogspot.com/2018/11/doomsday-by-2021.html
• Climate Plan
https://arctic-news.blogspot.com/p/climateplan.html
• Feedbacks
https://arctic-news.blogspot.com/p/feedbacks.html
• Extinction
https://arctic-news.blogspot.com/p/extinction.html
• Seismic Events
https://arctic-news.blogspot.com/p/seismic-events.html
• Can we weather the Danger Zone?
https://arctic-news.blogspot.com/2018/07/can-we-weather-the-danger-zone.html
• How much warmer is it now?
https://arctic-news.blogspot.com/2018/04/how-much-warmer-is-it-now.html
• What Does Runaway Warming Look Like?
https://arctic-news.blogspot.com/2018/10/what-does-runaway-warming-look-like.html
• Peaks Matter
https://arctic-news.blogspot.com/2018/08/peaks-matter.html
• Warning of mass extinction of species, including humans, within one decade
https://arctic-news.blogspot.com/2017/02/warning-of-mass-extinction-of-species-including-humans-within-one-decade.html