Showing posts with label anomaly. Show all posts

How much warmer is it now?

The IPCC appears to be strongly downplaying the amount of global warming that has already occurred and that looks set to eventuate over the next decade or so, according to a leaked draft of the IPCC 'Special Report on 1.5°C above pre-industrial'. The 'First Order Draft of the Summary for Policy Makers' estimates that the global mean temperature reached approximately 1°C above pre-industrial levels around 2017/2018.

Let's go over the numbers step by step, by following the image below line by line (click on the image to enlarge it).

NASA's data for the two most recent years for which data are available (2016/2017) show a warming of 0.95°C when using a baseline of 1951-1980 and a warming of 1.23°C when using a baseline of 1890-1910 (left map on image below). In other words, using this earlier baseline results in an additional 0.28°C rise. When using an even earlier baseline, i.e. 1750 or preindustrial, it could be 1.53°C warmer, as discussed in an earlier post.


In other words, merely changing the baseline to preindustrial, as agreed to at the Paris Agreement, can show that we're already above the 1.5°C guardrail that the Paris Agreement had pledged we should not cross.

There's more! As a recent publication points out, most methods that calculate the global temperature use sea surface temperatures. However, doesn't it make more sense to calculate the temperature of the air just above the sea surface? Measuring air temperature at the surface is done in the case of temperatures over land, where one doesn't measure the temperature of the soil or rocks when telling people how warm it is. Since air surface temperatures are slightly higher than sea surface temperatures, the result of looking at air surface temperatures across the globe would be a temperature that is approximately 0.1°C warmer. Furthermore, many areas in the Arctic may not have been adequately reflected in the global temperature, e.g. because insufficient data were available. Since the Arctic has been warming much faster than the rest of the world, inclusion of those areas would add another 0.1°C to the rise. Adding this to the above 1.53°C rise makes that it's already 1.73°C (or 3.11°F) warmer than preindustrial.

Another question is over what period measurements should be taken when assessing whether thresholds have been crossed. When focusing on temperatures during specific months, the rise could be much higher than the annual average. So, does it make more sense to look at a monthly peak rather than at a long-term average?

When building a bridge and when calculating what load the bridge should be able to handle, it makes sense to look at peak traffic and at times when a lot of heavy trucks happen to be on the bridge. That makes a lot more sense than only looking at the average weight of cars driving over the bridge during a period of - say - one, two or thirty years.


Accordingly, the right panel of the top image shows numbers for February 2016 when temperature anomalies were particularly high. When looking at this monthly anomaly, we are already 2.37°C (or 4.27°F) above preindustrial, i.e. well above the 2°C guardrail that the Paris Agreement had pledged we should definitely not cross.

Should the temperature rise be calculated using a longer period? The IPCC appears to have arrived at its temperature rise estimate by using an extrapolation or near term predictions of future warming so that the level of anthropogenic warming is reported for a 30 year period centered on today.

The image below, from an earlier post, shows global warming for a 30-year period centered on January 2018, using NASA 2003 to January 2018 LOTI anomalies from 1951-1980, adjusted by 0.59°C to cater for the rise from preindustrial to 1951-1980, and with a polynomial trend added.


If above trendline is adjusted by a further 0.2°C, by shifting to air temperatures instead of sea surface temperatures, and by better reflecting Arctic temperatures, then the trendline looks set to cross the 2°C guardrail in 2018. So, will Earth cross 2°C in 2018?


Above images illustrate the importance of what's going to happen next. The temperature rise up until now may well be dwarfed by what's yet to come and the outlook may well be even worse than what most fear will eventuate. The image below, from an earlier post, shows a steep rise from 2016 to 2026, due to the combined impact of the warming elements listed in the left box of the image below.


Meanwhile, the rise in carbon dioxide levels appears to be accelerating, as illustrated by the images below.


Indeed, despite pledges made at the Paris Agreement to limit the temperature increase to 1.5°C above pre-industrial, the rise in CO₂ since preindustrial, i.e. 1750, still appears to be accelerating.


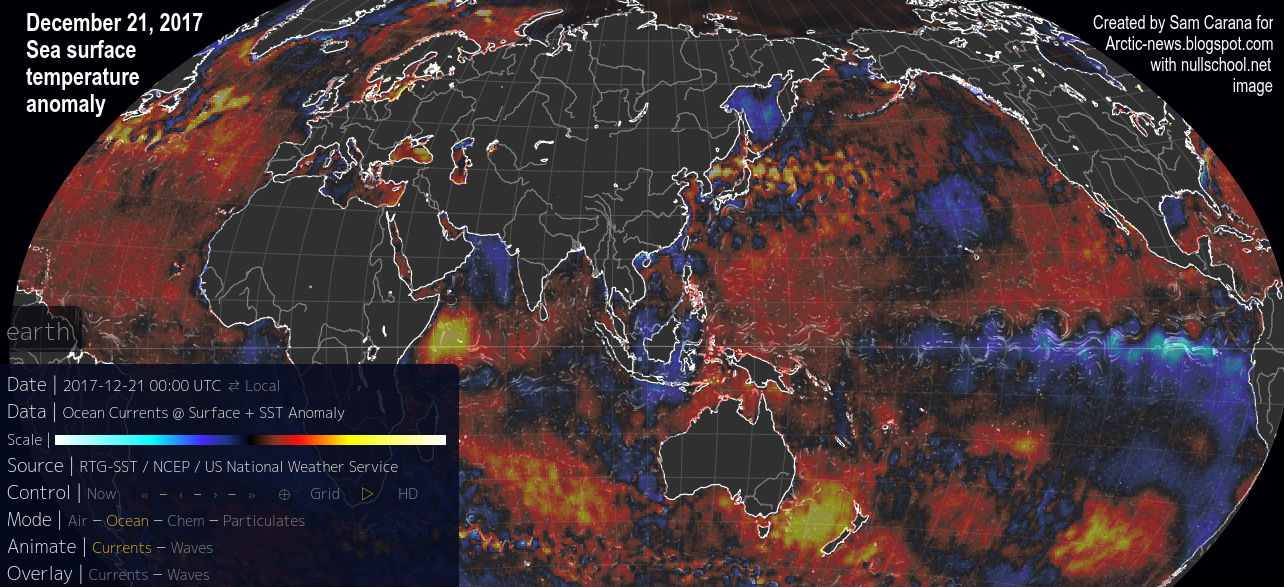
On March 18, 2018, the sea surface temperature near Svalbard (at the green circle) was 16.7°C or 62.1°F, i.e. 14.7°C or 26.4°F warmer than the daily average during the years 1981-2011.


On March 30, 2018, methane levels as high as 2624 parts per billion were recorded.


On April 1, 2018, methane levels as high as 2744 parts per billion were recorded.


The situation is dire and calls for comprehensive and effective action, as described in the Climate Plan.


Links

• Climate Plan
https://arctic-news.blogspot.com/p/climateplan.html

• Extinction
https://arctic-news.blogspot.com/p/extinction.html

• How much warming have humans caused?
https://arctic-news.blogspot.com/2016/05/how-much-warming-have-humans-caused.html

• IPCC seeks to downplay global warming
https://arctic-news.blogspot.com/2018/02/ipcc-seeks-to-downplay-global-warming.html

• 2016 well above 1.5°C
https://arctic-news.blogspot.com/2017/01/2016-well-above-1.5c.html

• Interpretations of the Paris climate target, by Andrew Schurer et al.
https://www.nature.com/articles/s41561-018-0086-8


Winds keep changing as warming continues

November 2017 was 0.87 degrees Celsius warmer than the mean 1951-1980 November temperature, as above image shows. The last three Novembers — 2015, 2016, and 2017 — are the three warmest in the entire modern record. The warmest month of November happened in 2015 (+1.03°C) when there was a strong El Niño, while we're currently in a La Niña period.

On the image below, cyclonic winds on December 21, 2017, are visible near the Philippines and Vietnam. Near the Philippines, 3-hour precipitation accumulation was as high as 121.6 mm or 4.79 in (at green circle). As a BBC report describes, Tropical Storm Tembin made landfall in the southern Philippines on December 22, 2017, causing flash flooding and mudslides. More than 180 people are reported to have been killed, as the tropical storm swept through Mindanao island, with dozens more missing.


A week earlier, Tropical Storm Kai-Tak hit the central Philippines, killing dozens. The region is still recovering from Typhoon Haiyan, which killed more than 5,000 people and affected millions in 2013.


The winds are fueled by high sea surface temperatures. Above image shows that, on December 21, 2017, sea surface temperatures were as high as 31.7°C or 89°F north of Australia. In line with rising temperatures caused by global warming, sea surface temperature anomalies are high across the oceans, as the image below illustrates.


As above image also shows, the sea surface was relatively cold at locations indicative for El Niño (depicted as four El Niño regions on the right).

The image below shows El Niño forecast plumes indicating that we're currently in a La Niña period, and that temperatures are on the rise.


In conclusion, just like the rise in temperatures is currently masked by a La Niña period, the return to a new El Niño period will further strengthen the rise.


This strengthening of winds is what can be expected in a warmer world. Above image shows a wavy Northern Polar Jet Stream combine with the Northern Subtropical Jet Stream to reach speeds as high as 401 km/h or 249 mph.

As the jet stream becomes more wavy and extends over the Arctic, more warm air and water gets carried into the Arctic, further speeding up warming, as also discussed at The Arctic is changing the Jet Stream - Why This Is Important.

The importance of Arctic warming was also discussed in the recent post Warming is accelerating. Changes to the Jet Stream can cause a lot more heat to be brought into the Arctic, through both the Bering Strait and the Fram Strait. This image below shows wind through the Bering Strait reaching speeds as high as 135 km/h or 84 mph.


The combination image below shows the Jet Stream extending over the Arctic Ocean and remaining in place for days, reaching speeds as high as 206 km/h or 128 mph. Such 'blocking' patterns can cause a lot of heat to be brought into the Arctic atmosphere, as well as into the water of the Arctic Ocean. The image in the left-hand panel indicates that temperature anomalies over the Arctic Ocean could be as high as 30°C or 54°F.

[ click on images to enlarge ]
As the temperature difference between the North Pole and the Equator decreases, the Jet Stream becomes more wavy, at times extending deep over the continents and bringing cold air to the south. This further increases the (already high) temperature difference between land and ocean, further speeding up cyclonic winds that move over the oceans toward the North Pole and that carry warm water and air toward the Arctic Ocean. The image below shows a forecast for January 1, 2018.


As sea ice keeps declining, ever less sunlight gets reflected back into space. The image below shows the decline in global sea ice area over the years.


The image below shows the average year-to-date Arctic sea ice volume (PIOMAS data).


This further confirms the updated trend analysis of the NASA temperature anomaly below.


The situation is dire and calls for comprehensive and effective action, as described in the Climate Plan.

Links

• Climate Plan
https://arctic-news.blogspot.com/p/climateplan.html

• Warming is accelerating
https://arctic-news.blogspot.com/2017/11/warming-is-accelerating.html

• The Arctic is changing the Jet Stream - Why This Is Important
https://arctic-news.blogspot.com/2017/10/the-arctic-is-changing-the-jet-stream-why-this-is-important.html

• NASA: November 2017 temperature news release
https://data.giss.nasa.gov/gistemp/news/20171218

• BBC: Philippines Tropical Storm Tembin kills 180 on Mindanao
https://www.bbc.com/news/world-asia-42464644

• NOAA: Four El Niño regions
http://www.cpc.ncep.noaa.gov/products/analysis_monitoring/ensostuff/nino_regions.shtml

• ECMWF: El Niño forecast plumes
https://www.ecmwf.int/en/forecasts/charts/catalogue/seasonal_system5_public_nino_plumes

• 10°C or 18°F warmer by 2021?
https://arctic-news.blogspot.com/2017/04/10c-or-18f-warmer-by-2021.html

• Abrupt Warming - How Much And How Fast?
https://arctic-news.blogspot.com/2017/05/abrupt-warming-how-much-and-how-fast.html

• Accelerating growth in CO₂ levels in the atmosphere
https://arctic-news.blogspot.com/2017/02/accelerating-growth-in-co2-levels-in-the-atmosphere.html

• High methane levels over the Arctic Ocean on January 14, 2014
https://arctic-news.blogspot.com/2014/01/high-methane-levels-over-the-arctic-ocean-on-january-14-2014.html

• Feedbacks
https://arctic-news.blogspot.com/p/feedbacks.html

• Extinction
https://arctic-news.blogspot.com/p/extinction.html

• Methane Erupting From Arctic Ocean Seafloor
https://arctic-news.blogspot.com/2017/03/methane-erupting-from-arctic-ocean-seafloor.html

• Warning of mass extinction of species, including humans, within one decade
https://arctic-news.blogspot.com/2017/02/warning-of-mass-extinction-of-species-including-humans-within-one-decade.html


Pursuing efforts?

Late last year at the Paris Agreement, nations pledged to hold the global average temperature rise to well below 2°C above pre-industrial levels and to pursue efforts to limit the temperature rise to 1.5°C above pre-industrial levels. On 5 October 2016, the threshold for entry into force of the Paris Agreement was achieved. The Paris Agreement will formally enter into force on 4 November 2016.


Meanwhile, as illustrated by above image, temperatures have been more than 1.5°C above pre-industrial levels for nine out of the past twelve months. For the months February and March 2016, the anomaly was actually quite close to the 2°C guardrail, while for station-only measurements, warming for February and March 2016 was well over the 2°C guardrail from pre-industrial levels.

The monthly warming in above image was calculated by using the NASA Global Monthly Mean Surface Temperature Change data (Land+Ocean) from 1880 through to September 2016, while adding 0.28°C to cater for the rise from 1900 to 1951-1980, and additionally adding 0.3°C to cater for the rise from pre-industrial to 1900.

[ click on image to enlarge ]
The 0.28°C adjustment (to cater for the rise from 1900 to 1951-1980) is illustrated by above graph, which has a polynomial trend added to the NASA Global Monthly Mean Surface Temperature Change (Land+Ocean) data from January 1880 through to September 2016.

As said, the top image has a further 0.3°C added to cater for the rise from pre-industrial to 1900, as discussed in an earlier post.


Above image shows sea surface temperature anomalies on the Northern Hemisphere, with a polynomial trend pointing at a doubling of ocean warming within one decade. Warming of the sea surface on the Northern Hemisphere threatens to speed up Arctic sea ice loss, as the Gulf Stream pushes ever warmer water toward the Arctic Ocean.


In addition, warming of the air over the Arctic Ocean occurs faster than elsewhere on Earth, as illustrated by above image and by the animation on the right.

This further speeds up the demise of the snow and ice cover, as illustrated by the images below.

Arctic sea ice extent on October 20, 2016, was at a record low for the time of the year, at only 6.15 million square km, as measured by the National Institute of Polar Research in Japan.


The images below show Arctic sea ice extent as measured by NSIDC.org (left) and average Arctic sea ice extent (year to date, October 20, 2016), from a post by Torstein Viðdalr (right).

Average Arctic sea ice extent for the period October 22, 2015 to October 20, 2016 (blue line) was lower than it was for any other 365-day period since 1978, when satellites first started measuring sea ice extent.


The images below show Arctic sea ice thickness as measured by the National Institute of Polar Research in Japan (left) and as measured by the Naval Research Laboratory (right, new model).

[ click on image to enlarge ]

Albert Kallio comments (in italics):
ARCTIC OCEAN SEA ICE GROWTH STOPS DUE TO HEAT BARRIER
The rapid growth of the sea ice has stopped because during the summer the surrounding ocean accumulated so much heat that it cannot yet freeze. Whilst the central Arctic Ocean around the North Pole saw a very rapid freezing as its broken sea ice cover quickly fused together in cold, autumn darkness breaking new records, it now has suddenly hit the opposite: a new all time record low for sea ice area for this time of season. This is because the ocean is still too warm for water to freeze around edges of the Arctic Ocean leading to all-time record low ice area that fell below or is at least in par with year 2012 low (the last record low ice year).


The image below (Arctic on the left, Antarctic on the right) was created by Daniel Kieve.
Daniel Kieve comments (in italics):
Both Arctic and Antarctic sea ice are now at record low extent for this time of year according to NSIDC data, with the Arctic sea ice over 2 million square kilometres lower than the average extent for 20th October. The Antarctic sea ice is at 2 standard deviations below the (30 year) average. At this time of year it's usually a time of rapid ice growth in the Arctic but it's stalled due to the continuance of anomalously warm air in parts of the Arctic and in particular the record warmth in the oceans that is encroaching more and more into the Arctic. This means next Summer the Arctic ice is more vulnerable than ever to collapse as the insolation reaches its peak in June and July.

Demise of the snow and ice cover in the Arctic further accelerates warming of the Arctic Ocean in a number of ways. Decline of sea ice extent makes that less sunlight gets reflected back into space and instead gets absorbed by the Arctic Ocean. Similarly, the decline of the snow and ice cover on land in the Arctic makes that more sunlight gets absorbed on land, which in turn make that warmer water from rivers flows into the Arctic Ocean. For more feedbacks, see the feedbacks page.

There's a growing danger is that further warming of the Arctic Ocean will trigger huge eruptions of methane from its seafloor. Ominously, on October 20, 2016, methane levels were as high as 2559 parts per billion, as illustrated by the image below, which also shows high methane levels over large parts of the Arctic Ocean.

The temperature rise resulting from such feedbacks has the potential to cause in mass extinctions (including humans) and destruction over the coming decade, as discussed at the extinction page.

The situation is dire and calls for comprehensive and effective action as described in the Climate Plan.


Links

 Climate Plan
http://arctic-news.blogspot.com/p/climateplan.html

 How Much Warming Have Humans Caused?
http://arctic-news.blogspot.com/2016/05/how-much-warming-have-humans-caused.html

 NASA GISS Surface Temperature Analysis (GISTEMP)
http://data.giss.nasa.gov/gistemp

 81 Parties have ratified of 197 Parties to the Convention
http://unfccc.int/paris_agreement/items/9485.php

 Paris Agreement
http://unfccc.int/resource/docs/2015/cop21/eng/10a01.pdf


August 2016 another month above Paris Agreement guardrail

[ click on images to enlarge ]
August 2016 was the warmest August in 136 years of modern record-keeping, according to a NASA news release and as illustrated by the image on the right.

The seasonal cycle makes that temperature typically peaks in July. Nonetheless, August 2016 wound up tied with July 2016 for the warmest month ever recorded.

So, when incorporating the seasonal cycle, it was more than 2°C or 3.6°F warmer in July and August 2016 than it used to be.

It's important to compare the temperature rise with preindustrial levels, given that end last year at the Paris Agreement countries pledged to keep temperatures from rising by more than 1.5°C above preindustrial levels. NASA typically calculates anomalies by comparing temperatures with the period from 1951 to 1980, so without adjustment and without including seasonal cycle, the picture looks like the one below.


The added polynomial trendline shows that the anomaly grows, when comparing the temperature rise with an period that goes back further. On the image below, a 0.28°C adjustment is applied to the data, to bring the baseline back to the year 1900.


Going back further than 1900 will result in even higher anomalies, as illustrated by the image below that applies a 0.58°C adjustment to cater for the rise before 1951-1980, as discussed in an earlier post, resulting in an August 2016 anomaly of 1.56°C.

As above image also shows, temperatures have been more than 1.5°C above preindustrial levels for most of the past 12 months.

The situation is dire and calls for comprehensive and effective action as described in the Climate Plan.

Links

 Climate Plan
http://arctic-news.blogspot.com/p/climateplan.html

 How Much Warming Have Humans Caused?
http://arctic-news.blogspot.com/2016/05/how-much-warming-have-humans-caused.html

 NASA Analysis Finds August 2016 Another Record Month
http://data.giss.nasa.gov/gistemp/news/20160912


2016 Heat Felt Around Globe

created by Sam Carana with JAXA image
Above image shows that 2016 Arctic sea ice extent has been very low, if not at record low, up to April 30, 2016. This situation doesn't appear likely to improve, due to high ocean heat causing melting from below and high air temperatures that cause melting from above and that also cause water to warm up in rivers ending up in the Arctic Ocean.

The image below shows that on April 28, 2016, sea surface off the coast of North America was as much as 12.3°C or 22.1°F warmer than in 1981-2011. The Gulf Stream will make that much of this heat will arrive in the Arctic Ocean over the next few months.


The image below compares April 30 sea surface temperature anomalies between 2015 (left panel) and 2016 (right panel), showing that the sea surface in many areas is warmer in 2016 than it was in 2015.


Next to sea surface temperatures, air temperatures are rising, as illustrated by the image on the right, showing temperatures over Alaska as high as 14.6°C or 58.4°F at 64.5°N and as high as 10.8°C or 51.4°F at 66.5°N on May 1, 2016. Such rising temperatures over land will warm up rivers that will in turn warm up the Arctic Ocean.

The Google reference map below shows a large part of the Arctic Ocean, including Alaska on the left and the Beaufort Sea at the bottom. The map has an added red square inset that indicates the outlines of the map further below, which zooms in further on the Beaufort Sea.


The April 26, 2016, NASA map below shows that, while it is in places still relatively thick, the sea ice in the Beaufort Sea is strongly fractured with much water showing up in the fractures, and even more water along the coast.


Worryingly, high methane peaks have been recorded recently, as high as 2810 ppb on April 29, 2016, as illustrated by the image below, showing a large area with high methane levels east of Greenland.


Meanwhile, the heatwave in South-East Asia continues, with temperatures as high as 49°C or 120.1°F recorded on April 27, 2016, as illustrated by the image on the right.

As the image below shows, temperatures do not appear to be coming down, with temperatures as high as 49.4°C or 120.8°F forecast to hit India on May 2, 2016 (at the location marked by the green circle).

As global warming continues, this will make humidity levels rise. A 3°C warming will cause about 25% increase in absolute humidity, which will make it feel at least 6°C hotter. Moreover, water vapor is a potent greenhouse gas, further accelerating global warming.


The situation is dire and calls for comprehensive and effective action, as described at the Climate Plan.


March temperature


Above image shows Land-Ocean (in red) and Land-only (in black) global monthly temperature anomalies compared to the average over the period 1951-1980.

At the Paris Agreement, nations committed to strengthen the global response to the threat of climate change by holding the increase in the global average temperature to well below 2°C above pre-industrial levels and to pursue efforts to limit the temperature increase to 1.5°C above pre-industrial levels.

To see how much temperatures have risen compared to pre-industrial levels, a comparison with the period 1951-1980 does not give the full picture. The image below, created by selecting a smoothing radius of 1200 km, shows that the global temperature rise from 1890-1910 was 1.58°C or 2.84°F.


The temperature rise is even higher when looking at measurements from land-only stations. The image below compares the March 2016 temperature with the period from 1890-1910 (250 km smoothing), showing a Land-only anomaly of 2.42°C or 4.36°F.


Taking into account that temperatures had already risen by some 0.3°C (0.54°F) before 1900, this adds up to a total temperature rise on land in March 2016 of 2.72°C (4.9°F) from the start of the industrial revolution.

On the Northern Hemisphere, there was an even more dramatic temperature rise on land. In March 2016, on land on the Northern Hemisphere, it was 4.9°F or 2.72°C warmer than the 20th century average, as illustrated by the image below.

How much of this rise can be attributed to El Niño? One way to answer this question is by adding a polynomial trend, as in the March Northern Hemisphere Land Temperature Anomaly image below, showing that temperatures had already risen by 2°C in March 2015, while pointing at a rise of 4°C by March 2030 and 10°C before the year 2050.


The trendline also shows that a temperature difference of about half a degree Celsius between the 20th century average and the year 1900. Taking into account that temperatures had already risen by some 0.3°C (0.54°F) before 1900, this adds up to a total temperature rise on land on the Northern Hemisphere in March 2016 of 3.52°C or 6.34°F from the start of the industrial revolution.

NOAA data show that in March 2016, it was 2.33°C or 4.19°F warmer on land globally than the 20th century average. When compared to temperatures around the year 1900, it was even warmer.

In February 2016, NASA data show that it was 2.33°C or 4.19°F warmer on land (with 1200 km smoothing) than it was in 1890-1910, while it was 2.48°C or 4.46°F warmer for a 250 km smoothing radius for the land-only data. In an earlier post, a 2.3°C rise in February 2016 was used as one of several elements making up the total rise that could eventuate on land by the year 2026, assuming that no geoengineering will take place (image below).


Meanwhile, the current El Niño is still going strong and causing very high temperatures, making one wonder how high temperatures will be during the next El Niño, which could eventuate a decade or less from now. The image below shows high temperatures at four locations in South-East Asia on April 20, 2016.


The situation is dire and calls for comprehensive and effective action, as described in the Climate Plan.
Designed with by Way2themes | Distributed by Blogspot Themes