Showing posts with label clathrates. Show all posts

Heat Storm

[ click on images to enlarge ]
On April 11, 2018, Arctic sea ice extent was only 13.9 million km². Arctic sea ice extent has been at a record low for the time of year for most of 2018, as illustrated by above image. In 2012, extent went below 3.4 million km². The question is what minimum 2018 extent will be.

Arctic sea ice could disappear altogether in 2018. Have a look at the progressive loss of sea ice volume depicted in the image on the right, from an earlier post. Zero sea ice volume by 2018 is within the margins of the trend line contained in the data going back to 1979.

What drives volume decline is the combination of extent loss and especially thickness loss. Sea ice thickness has declined particularly where the ice once was at its thickest, i.e. north of Greenland and the Canadian Arctic Archipelago.

The combination image below shows the decline of the thicker sea ice, by comparing sea ice thickness on April 15 (run April 14) for the years 2015 through to 2018, showing that sea ice this year is entering the melting season with little or no thick sea ice left north of Greenland and the Canadian Arctic Archipelago to cope with the influx of warmer water.


The image below shows how much Bering Strait sea ice is at a historic low and the associated International Arctic Research Center post describes that this is caused by higher ocean temperatures and frequent storms.


The influx of warm water from the Atlantic Ocean and from the Pacific Ocean is melting the sea ice from below, while sunlight is melting the sea ice from above. Furthermore, warm water from rivers that end in the Arctic Ocean also contribute to melting of the sea ice, and there are numerous feedbacks that can dramatically speed up melting.

Disappearance of the sea ice means that the buffer that until now has consumed huge amounts of heat, will be gone and that heat that previously went into melting the sea ice, will instead warm up the Arctic.

Sea ice can be expected to continue its downward spiral, given the continued rise of the temperature of the sea surface in the North Atlantic Ocean and the North Pacific Ocean, as illustrated by the image below.


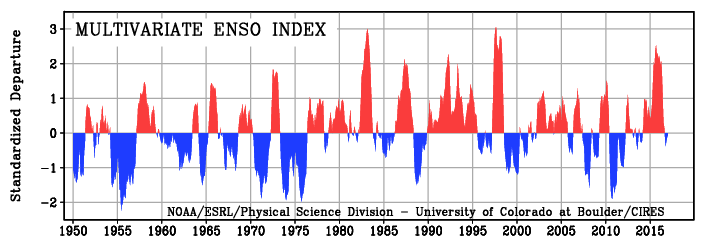
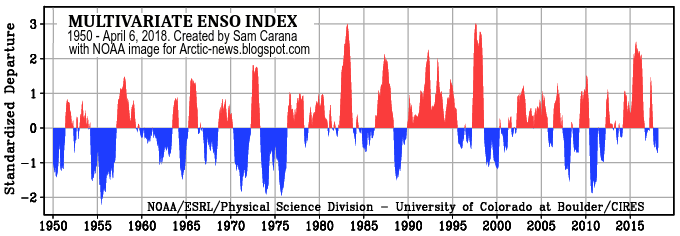
The sea surface is not necessarily the place where the water is at its warmest. This is illustrated by the image below, showing subsurface ocean heat in the area most relevant to El Niño/La Niña events.


[ click on images to enlarge ]
We're currently still in a La Niña period in which temperatures are suppressed, as illustrated by the Multivariate El Niño/Southern Oscillation (ENSO) Index image on the right.

As illustrated by the forecast plumes image underneath on the right, it looks like a new El Niño will arrive this summer, which will elevate temperatures from the trend.

This could result in a heat storm as early as summer 2018, in which heat waves could decimate the sea ice, while storms could push the remaining sea ice out of the Arctic Ocean.

This danger is further illustrated by the trend line in the image below, a trend that is contained in NASA LOTI data up to March 2018, adjusted by +0.79°C to better reflect the rise from preindustrial and surface air temperatures, and to better include Arctic temperatures.


[ click on images to enlarge ]
The temperature rise in the Arctic is causing decline of the sea ice extent as well as the extent of the snow cover on land.

The image on the right shows the progressive decline of the spring snow cover on land in the Northern Hemisphere.

A recent study shows that the amount of water melt from the glaciers on Mt. Hunter, Alaska, is now 60 times greater than it was before 1850.

Heat waves combined with strong rainfall due to storms could devastate the snow cover in 2018.

Decline of the snow and ice cover in the Arctic comes with a huge loss in albedo, which means that huge amounts of sunlight that were previously reflected back into space instead get absorbed by the Arctic.

The Buffer has gone, feedback #14 on the Feedbacks page
A rapid rise in temperatures in the Arctic will also accelerate changes to jet stream, which can cause huge amounts of heat from the Atlantic Ocean and the Pacific Ocean to enter the Arctic Ocean, further speeding up its warming and threatening to destabilize methane hydrates in sediments under the Arctic Ocean.

The methane will initially be felt most strongly in the Arctic, further speeding up Arctic warming which is already accelerating due to numerous feedbacks including - as said - the loss of the snow and ice cover in the Arctic, which makes that less sunlight is reflected back into space and instead adds to warming up the Arctic.

All this shouldn't come unexpected. In the video below, Guy McPherson warns that a rapid temperature rise will affect agriculture across the globe, threatening to cause a collapse of industrial civilization, in turn resulting in an abrupt halt of the sulfates that are currently co-emitted as a result of burning fuel, which will further add to a temperature rise that is already threatening to cause people across the globe to perish at massive scale, due to heatstroke, dehydration and famine, if not perish due to nuclear radiation and further toxic effects of war, as people fight over who controls the last habitable places on Earth.


Guy mentions the President of Finland, Sauli Niinistö, who in a press conference on August 28, 2017, warns that: "If we lose the Arctic, we lose the globe". The video below shows an extract of the press conference.


The situation is dire and calls for comprehensive and effective action, as described in the Climate Plan.

Links

• Climate Plan
https://arctic-news.blogspot.com/p/climateplan.html

• Feedbacks in the Arctic
https://arctic-news.blogspot.com/p/feedbacks.html

• How much warmer is it now?
https://arctic-news.blogspot.com/2018/04/how-much-warmer-is-it-now.html

• Extinction
https://arctic-news.blogspot.com/p/extinction.html

• Ten Dangers of Global Warming
https://arctic-news.blogspot.com/p/ten-dangers-of-global-warming.html

• Methane Erupting From Arctic Ocean Seafloor
https://arctic-news.blogspot.com/2017/03/methane-erupting-from-arctic-ocean-seafloor.html

• Warning of mass extinction of species, including humans, within one decade
https://arctic-news.blogspot.com/2017/02/warning-of-mass-extinction-of-species-including-humans-within-one-decade.html

• In the coastal communities near the Bering Strait, a winter unlike the rest
https://www.climate.gov/news-features/features/coastal-communities-near-bering-strait-winter-unlike-rest

• A 400‐Year Ice Core Melt Layer Record of Summertime Warming in the Alaska Range
https://agupubs.onlinelibrary.wiley.com/doi/abs/10.1002/2017JD027539

• Warning Signs
https://arctic-news.blogspot.com/2018/03/warning-signs.html


Arctic sea ice may well be gone by September 2017

The Arctic Ocean is warming up fast and this is melting the sea ice from below.

Sea surface temperature anomalies are well above 8°C (14.4°F) in several parts of the Arctic Ocean.

The image on the right shows sea surface temperature anomalies from 1961-1990 for the Arctic (60°N - 90°N) on August 2, 2017.

Global sea ice extent is at a record low for the time of the year, as illustrated by the graph below, by Wipneus. Lower sea ice extent means that less sunlight is reflected back into space.


Arctic sea ice extent in 2017 is shrinking along a path that currently looks similar to the years 2012, 2016 and 2007, when sea ice reached 1st, 2nd and 3rd place, respectively, regarding lowest extent (image right).

Arctic sea ice volume has been at record low since the start of 2017 and is currently similar to 2012, as illustrated by the graph below right, by Wipneus (click on images to enlarge them).

Arctic sea ice may look to be similar to what it was in 2012, when extent and volume reached lowest since satellite measurements began.

However, sea ice thickness has fallen dramatically over the years in the areas where previously was the thickest ice.

This is illustrated by the combination image below, showing Arctic sea ice thickness (in m) in July 31, 2012 (left panel) versus thickness on July 31, 2017 (right panel).

[ click to enlarge ]
The navy.mil animation on the right shows sea ice getting thinner recently, with especially the thicker sea ice disappearing fast.

There appear to be discrepancies between the PIOMASS calculation of ice volume and the ice thickness images by navy.mil.
This may be due to the way volume is calculated and may be similar to differences in extent and area.

Sea ice clearly has disappeared most where once the thickest ice was present.


Harold Hensel points out that extent may at first glance show more ice but each cell in a grid may only have 15% of ice present to be labeled 'ice-covered'. Harold adds an image showing ice concentration, which gives another insight in the shape and condition of the sea ice (above image).

Paul Beckwith and Patrick McNulty bluntly conclude that PIOMAS is wrong, as illustrated by the Twitter screenshot on the right.

Clearly, dramatic shrinking of the thicker sea ice has occurred over the past few years and one of the reasons for this is the ever warmer water that is getting pushed into the Arctic Ocean along the Gulf Stream. This is melting the sea ice from below. Warming of the Arctic Ocean heats up the air over the Arctic Ocean, as illustrated by the image below.


[ click on image to enlarge ]
The above image shows a 365-day surface temperature anomaly. The change over time is also illustrated by the animation on the right.

On average, surface temperatures over the Arctic Ocean have been more than 2.5°C (or 4.5°F) warmer than in 1981-2010. The warmer air is now also melting the sea ice from above, as temperatures over the Arctic have risen to well above the freezing point.

High temperatures over the Arctic Ocean means that precipitation no longer takes the form of snow, but instead falls in the form of rain.


Below is a further warning, against a more recent background image (situation on August 6, 2017).


[ click on image to enlarge ]
High temperatures of the surface of the ocean combined with strong winds makes that a lot of moisture is rising from the sea surface to the atmosphere.

The image on the right shows that sea surface temperatures in the Bering Strait were as high as 19°C (or 66.2°F) on July 22, 2017. This is partly the result of warm water from rivers entering the Bering Strait.

Furthermore, cyclones can make winds reach high speeds, as illustrated by the image below, showing Typhoon Noru approaching Japan.

The image shows a forecast for August 5, 2017, 18:00 UTC. Waves have been forecast to be as high as 16.15 m or 53 ft, while winds have been forecast to be as fast as 214 km/h or 133 mph or 116 kn.

[ click on image to enlarge ]
Total precipitable water has been forecast to be as much as 91.000 kg/m² and 3-hr Precipitation Accumulation has been forecast to be as much as 281.3 mm (or 281.3 kg/m²) or 11.07 in.

Back to the Arctic, where strong winds and moist air combine to make a lot of rain, as temperatures are well above freezing in most areas, as illustrated by the image on the right (showing air temperature at 2 m).

The image below shows how strong winds are pushing warm and moist air through the Bering Strait on July 31, 2017 at surface level (left), at 700 hPa (center) and at 250 hPa (right), where the jet stream used to separate the cold air in the Arctic from the warmer air further south.


As above image also shows, the jet stream is getting more and more out of shape, at places crossing the Arctic Ocean. In the video below, Paul Beckwith discusses the situation in the Arctic.


The image below shows trends for both Arctic and Antarctic sea ice area pointing downward.


When looking at sea ice volume, zero sea ice in September 2017 is within the margins of the trendline below on the right.

[ Arctic sea ice, gone by Sept. 2017? ]
Given the speed at which many feedbacks can kick in and the interaction between warming elements, Arctic sea ice volume may well be gone by September 2017.

The low sea ice volume means that there is very little sea ice left to act as a buffer this year. Therefore, a huge amount of heat will not be able to be consumed this year in the process of melting ice and will instead speed up warming of water of the Arctic Ocean.

Less sea ice additionally means that less sunlight will be reflected back into space, and this heat will instead further speed up Arctic warming.

The Buffer has gone, feedback #14 on the Feedbacks page

Where can all this extra heat go? Sea ice is expected to start sealing off much of the surface of the Arctic Ocean by the end of September 2017, which will make it harder for heat to escape the Arctic Ocean by entering the atmosphere.

The danger is that much of the extra heat will instead reach sediments at the seafloor of the Arctic Ocean that contain huge amounts of methane in currently still frozen hydrates.

The image on the right shows that methane reached levels as high as 2583 ppb on July 31, 2017.

The image also shows high methane levels over Antarctica where hydrate destabilization also appears to be taking place, as discussed in an earlier post.

The situation is dire and calls for comprehensive and effective action, as described at the Climate Plan.


Links

• Climate Plan
https://arctic-news.blogspot.com/p/climateplan.html

• 10°C or 18°F warmer by 2021?
https://arctic-news.blogspot.com/2017/04/10c-or-18f-warmer-by-2021.html

• Abrupt Warming - How Much And How Fast?
https://arctic-news.blogspot.com/2017/05/abrupt-warming-how-much-and-how-fast.html

• Accelerating growth in CO₂ levels in the atmosphere
https://arctic-news.blogspot.com/2017/02/accelerating-growth-in-co2-levels-in-the-atmosphere.html

• Feedbacks
https://arctic-news.blogspot.com/p/feedbacks.html

• Extinction
https://arctic-news.blogspot.com/p/extinction.html

• Methane Erupting From Arctic Ocean Seafloor
https://arctic-news.blogspot.com/2017/03/methane-erupting-from-arctic-ocean-seafloor.html

• Warning of mass extinction of species, including humans, within one decade
https://arctic-news.blogspot.com/2017/02/warning-of-mass-extinction-of-species-including-humans-within-one-decade.html


More heat on the way


Above image shows temperature anomalies over the Pacific Ocean on February 12, 2017. Note the 19.2°C (34.5 °F) anomaly off the coast of Japan, at the location marked by the green circle.

In 2016, the annually-averaged temperature for ocean surfaces around the world was 0.75°C (1.35°F) higher than the 20th century average, higher than the previous record of 2015, NOAA reports. The global annual land surface temperature for 2016 was 1.43°C (2.57°F) above the 20th century average, surpassing the previous record of 2015 by 0.11°C (0.19°F). Note that NOAA uses the the 20th century average as a baseline, for more on different baselines, see this earlier post.

There is more heat on the way, as illustrated by the image below.


As above image shows, the El Niño-Southern Oscillation (ENSO) temporarily raises (El Niño) or suppresses (La Niña) global temperatures. Generally, the stronger the event (El Niño or La Niña), the greater its impact on the average global temperature around that time. Note that one value for 2016 literally went off the chart.


As above image shows (at the end of the graph on the right), we've barely had a bit of a La Niña in 2017 and we're already facing another El Niño event.

[ click on images to enlarge ]

Above images shows ECMWF (European Centre for Medium-Range Weather Forecasts) plumes with strong positive anomalies in all three El Niño regions (on the right).

In other words, temperatures in 2017 look set to be very high, which spells bad news for the Arctic where temperature anomalies are already several times higher than in the rest of the world, as illustrated by the image below.

As the image below shows, Antarctic sea ice extent was at a record low for the time of the year on February 11, 2017.


The situation looks particularly grim for the Arctic sea ice. As the image below shows, Arctic sea ice extent on February 11, 2017, was also at a record low for the time of the year. In fact, it had fallen to 13,895,00 km² that day, raising the question whether perhaps the maximum for the year 2017 had already been reached.


Low global sea ice extent means that less sunlight is reflected back into space by the ice and that more heat is instead absorbed by the ocean, adding to the predicament the world is in. The situation in the Arctic is crucial, as huge amounts of methane, contained in sediments under the Arctic Ocean, could be released if warming continues, potentially triggering mass extinction of species, including humans, within one decade.

The situation is dire and calls for comprehensive and effective action as described in the Climate Plan.


Links


• Climate Plan
http://arctic-news.blogspot.com/p/climateplan.html

• Extinction
http://arctic-news.blogspot.com/p/extinction.html

• How much warming have humans caused?
http://arctic-news.blogspot.com/2016/05/how-much-warming-have-humans-caused.html

• Warning of mass extinction of species, including humans, within one decade
http://arctic-news.blogspot.com/2017/02/warning-of-mass-extinction-of-species-including-humans-within-one-decade.html


Lake Baikal

The amount of methane stored in the form of hydrates at the bottom of Lake Baikal in Siberia is an estimated 1 trillion m³, which translates into 424 trillion kg of methane, or 424 Gt of methane. By comparison, the amount of methane in the atmosphere is about 5 Gt.


Aral Sea
Methane hydrates remain stable under a combination of sufficiently low temperatures and sufficiently high pressure. The temperature of the water at the bottom of the lake is about 3.5°C. This means that a large amount of water needs to remain present in the lake at any time, in order to keep the methane hydrates stable.

Lake Baikal is the world's deepest lake. Due to its depth, Lake Baikal is also the largest freshwater lake by volume in the world, containing roughly 20% of the world's unfrozen surface fresh water. Lake Baikal has 23,615.39 km³ (5,700 cu mi) of fresh water and a maximum depth of 1,642 m (5,387 ft).

If the water level in Lake Baikal were to fall, the pressure on the methane hydrates would decrease, resulting in huge methane eruptions, dwarfing the amount of methane currently in the atmosphere.

What are the chances that water levels in Lake Baikal will fall in future? The above animation shows the fate of the Aral Sea, further to the west in Asia (also on the map at top). The Aral Sea virtually disappeared over the course of the last few decades. Some people point at climate change as the cause. More people point at irrigation by farmers.
Yenisei River

Lake Baikal could go the same way. Climate change may well reduce the flow of the rivers that now feed Lake Baikal from Mongolia (image right). Furthermore, climate change may well reduce crop yields worldwide as well as the availability of fresh water, increasing temptations to use the water of Lake Baikal for irrigation.

Further decline of Arctic sea ice is likely to push up temperatures across Russia. The image below shows that temperatures as high as 36.6°C or 97.8°F were forecast for June 13, 2016, over the Yenisei River in Siberia that ends in the Arctic Ocean.
[ click on images to enlarge or go to original post ]
Even higher temperatures were recorded in 2015 at a location in Siberia well within the Arctic Circle.

Demands for water could increase even more dramatically due to wildfires and the need to fight such fires. The image below shows that on June 23, 2016, wildfires north of Lake Baikal caused emissions as high as 22,953 ppb CO and 549 ppm CO₂ at the location marked by the green circle.

[ click on images to enlarge or go to original post ]
The situation is dire and calls for comprehensive and effective action, as described at the Climate Plan.


Links

 Climate Plan
http://arctic-news.blogspot.com/p/climateplan.html

 Gone: endemic Baikal sponge has died completely in several areas of the vast lake
http://siberiantimes.com/ecology/casestudy/features/f0278-gone-endemic-baikal-sponge-has-died-completely-in-several-areas-of-the-vast-lake/

 Volume to weight conversion
http://www.aqua-calc.com/calculate/volume-to-weight

 Lake Baikal, Wikipedia
https://en.wikipedia.org/wiki/Lake_Baikal

 Aral Sea, Wikipedia
https://en.wikipedia.org/wiki/Aral_Sea

 Climate Feedbacks Start To Kick In More
http://arctic-news.blogspot.com/2016/06/climate-feebacks-start-to-kick-in-more.html

 High Temperatures In Arctic
http://arctic-news.blogspot.com/2016/06/high-temperatures-in-arctic.html

 East Siberian Heat Wave
http://arctic-news.blogspot.com/2015/07/east-siberian-heat-wave.html

 Wildfires in Russia's Far East
http://arctic-news.blogspot.com/2016/08/wildfires-in-russias-far-east.html


Seafloor Methane


Methane levels over the Arctic Ocean are higher than elsewhere on Earth. As the animation below shows, methane levels were as high as 2436 parts per billion (ppb) on the afternoon of December 5, 2016, with most methane rising up from the water, in particular over the Arctic Ocean.

Rise in the atmosphere of methane on December 5, 2016 (MetOp 1 pm), from 1000 mb, i.e. close to
sea level, up to a pressure of 586 mb, which corresponds with an altitude of 3833 m.

Methane levels over the Arctic Ocean have been high for more than a month. The video below, with a soundtrack by Daniel Kieve, shows methane levels from October 26, 2016 to November 25, 2016.


&nbsp

These high methane levels come at a time when there's hardly any sunlight reaching the Arctic, which pretty much rules out the possibility that algae blooms or other biological sources were causing these high methane levels. Instead, these high methane levels appear to be the result of methane eruptions from the seafloor of the Arctic Ocean, caused by warming water of the oceans.


Indeed, large quantities of methane appear to be erupting from seafloor of the Arctic Ocean and, as this methane rises in the atmosphere, it moves closer to the Equator, resulting in higher methane levels there as well. Above image further illustrates that seafloor methane appears to be pushing up mean global methane level at higher altitudes.

The image below shows the temperature rise of the oceans. Temperatures are rising particularly rapidly on the Northern Hemisphere.

[ Ocean warming, from earlier post ]
The huge amounts of energy entering the oceans translate into higher temperatures of the water and of the air over the water, as well as higher waves and stronger winds. Much of that heat is carried by the Coriolis force along the Gulf Stream from the coast of North America via the North Atlantic into the Arctic Ocean.

As the image on the right shows, sea surface temperatures near Svalbard (green circle) were as high as 14.1°C / 57.3°F on December 6, 2016, 12.1°C / 21.7°F warmer than in 1981-2011.

The rise in ocean heat is threatening to cause ever larger eruptions of methane from the seafloor.

As described at the Extinction page, methane eruptions from the seafloor could well cause a 1.1°C temperature rise over the next ten years, and in combination with other elements, this is threatening to cause global temperature to rise 10°C or 18°F by 2026.

The situation is dire and calls for comprehensive and effective action as described in the Climate Plan.


Links

• A pdf of the extinction page and an introduction to the Climate Plan can be downloaded from
https://sites.google.com/site/samcarana/climateplan/Climate-Plan-by-Sam-Carana.pdf?attredirects=0&d=1

 Climate Plan
https://arctic-news.blogspot.com/p/climateplan.html

 Methane
https://arctic-news.blogspot.com/p/methane.html

 Extinction
https://arctic-news.blogspot.com/p/extinction.html

 Old Mother Nature, by Daniel Kieve
https://soundcloud.com/danielkieve/old-mother-nature


Designed with by Way2themes | Distributed by Blogspot Themes