Blue Ocean Event as part of four Arctic tipping points
What will be the consequences of a Blue Ocean Event, i.e. the disappearance of virtually all sea ice from the Arctic Ocean, as a result of the warming caused by people?

Paul Beckwith discusses some of the consequences in the video below. As long as the Arctic Ocean has sea ice, most sunlight gets reflected back into space and the 'Center-of-Coldness' remains near the North Pole, says Paul. With the decline of the sea ice, however, the 'Center-of-Coldness' will shift to the middle of Greenland. Accordingly, we can expect the jet streams to shift their center of rotation 17° southward, i.e. away from the North Pole towards Greenland, with profound consequences for our global weather patterns and climate system, for plants and animals, and for human civilization, e.g. our ability to grow food.
Also see Paul's video below, The Arctic Blue-Ocean-Event (BOE). When? Then What?
Changing Winds

As global warming continues, the additional energy in the atmosphere causes stronger winds and higher waves.
As the Arctic warms up faster than the rest of the world, the jet streams are getting more out of shape, exacerbating extreme weather events.
The image on the right shows the jet stream crisscrossing the Arctic Ocean on September 10, 2018, with cyclonic wind patterns all over the place.
On the image below, Typhoon Mangkhut is forecast to cause waves as high as 21.39 m or 70.2 ft on September 14, 2018.

The inset on above image shows Typhoon Mangkhut forecast to cause winds to reach speeds as high as 329 km/h or 205 mph at 700 hPa (green circle), while Hurricane Florence is forecast to hit the coast of North Carolina, and is followed by Hurricane Isaac and Hurricane Helene in the Atlantic Ocean.

 At 850 hPa, Typhoon Mangkhut reaches Instant Wind Power Density as high as 196.9 kW/m² on September 13, 2018, as illustrated by above image.
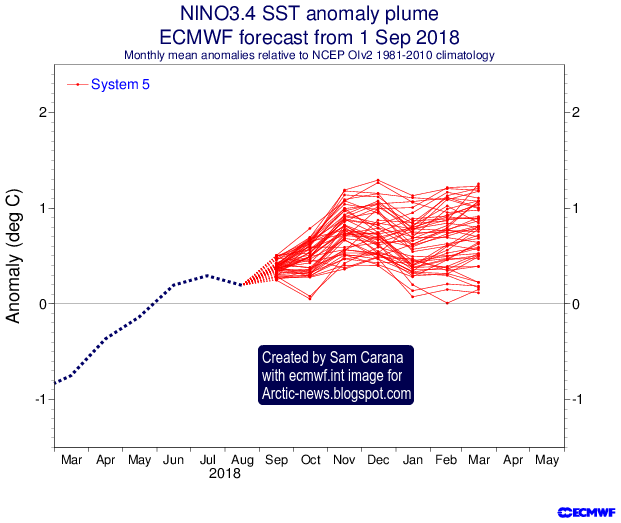
The situation is likely to get worse over the next few months, as this is only the start of the hurricane season and El Niño is strengthening, as illustrated by the image on the right.
The image below shows how the occurrence and strength of El Niño has increased over the decades.

Four Arctic Tipping Points
There are numerous feedbacks that speed up warming in the Arctic. In some cases, there are critical points beyond which huge changes will take place rather abruptly. In such cases, it makes sense to talk about tipping points.
1. The albedo tipping point

At the other hemisphere, the sea ice around Antarctica is at its lowest extent for the time of the year, as illustrated by above image. Global sea ice extent is also at its lowest for the time of the year, as illustrated by the image below.

A Blue Ocean Event will not only mean that additional heat will have to be absorbed in the Arctic, but also that wind patterns will change radically and even more dramatically than they are already changing now, which will also make that other tipping points will be reached earlier. This is why a Blue Ocean Event is an important tipping point and it will likely be reached abruptly and disruptively.
2. The latent heat tipping point
 Disappearance of the sea ice north of Greenland is important in this regard. The image on the right shows that most sea ice at the end of August 2018 was less than 1 meter thick.
The image below shows how the sea ice has been thinning recently north of Greenland and Ellesmere Island, an area once covered with the thickest multi-year sea ice. Disappearance of sea ice from this area indicates that we're close to or beyond the latent heat tipping point, i.e. the point where further ocean heat can no longer be consumed by the process of melting the sea ice.
The amount of energy absorbed by melting ice is as much as it takes to heat an equivalent mass of water from zero to 80°C. Without sea ice, additional ocean heat will have to go somewhere else.

Above image shows how much sea surface temperatures in the Arctic have warmed, compared to 1961-1990. The image also shows the extent of the sea ice (white). In the image below, a large area has changed from sea ice to water twelve days later, showing how thin and fragile the sea ice is and how easily it can disappear as the water continues to warm.

As the Arctic is warming faster than the rest of the world, changes have been taking place to the jet streams on the Northern Hemisphere that make it easier for warm air and water to move into the Arctic. This means that warm water is increasingly entering the Arctic Ocean that can no longer be consumed by melting the sea ice from below.
Arctic sea ice extent has remained relatively large this year, since air temperatures over the Arctic Ocean have been relatively low in June and July 2018. At the same time, ocean heat keeps increasing, so a lot of heat is now accumulating underneath the surface of the Arctic Ocean.
3. Seafloor Methane Tipping Point
As said above, Arctic sea ice has been getting thinner dramatically over the years, and we are now near or beyond the latent heat tipping point.
 This year, air temperatures over the Arctic Ocean were relatively low in June and July 2018, and this has kept Arctic sea ice extent larger than it would otherwise have been. As a result, a lot of heat has been accumulating underneath the surface of the Arctic Ocean and this heat cannot escape to the atmosphere and it can no longer be consumed by melting. Where will the heat go?
As the temperature of the Arctic Ocean keeps rising, more heat threatens to reach sediments at its seafloor that have until now remained frozen. Contained in these sediments are huge amounts of methane in the form of hydrates and free gas.
Melting of the ice in these sediments then threatens to unleash huge eruptions of seafloor methane that has been kept locked up in the permafrost for perhaps millions of years. Seafloor methane constitutes a third tipping point.

The image on the right features a trend based on WMO data. The trend shows that mean global methane levels could cross 1900 ppb in 2019.
Ominously, methane recently reached unprecedented levels. Peak levels as high as 3369 ppb on August 31, 2018, as shown by the image below on the right.
The next image on the right below shows that mean global levels were as high as 1905 ppb on September 3, 2018.
 The third image below on the right may give a clue regarding the origin of these unprecedented levels.
More methane will further accelerate warming, especially in the Arctic, making that each of the tipping points will be reached earlier.
 Less sea ice will on the one hand make that more heat can escape from the Arctic Ocean to the atmosphere, but on the other hand the albedo loss and the additional water vapor will at the same time cause the Arctic Ocean to absorb more heat, with the likely net effect being greater warming of the Arctic Ocean.
Additionally, more heat is radiated from sea ice into space than from open water (feedback #23).
How much warming could result from the decline of snow and ice cover in the Arctic?
As discussed, there will be albedo changes, there will be changes to the jet streams, and there will be further feedbacks, adding up to 1.6°C of additional global warming that could eventuate due to snow and ice decline and associated changes in the Arctic.
A further 1.1°C of warming or more could result from releases of seafloor methane over the next few years.
4. Terrestrial Permafrost Tipping Point
Additional warming of the Arctic will also result in further warming due to numerous feedbacks such as more water vapor getting into the atmosphere. Furthermore, more intense heatwaves can occur easier in the Arctic due to changes to jet streams. All this will further accelerate melting of the ice in lakes and in soils on land that was previously known as permafrost. This constitutes a fourth tipping point that threatens to add huge amounts of additional greenhouse gases to the atmosphere. Until now, the permafrost was held together by ice. As the ice melts, organic material in the soil and at the bottom of lakes starts to decompose. The land also becomes increasingly vulnerable to landslides, sinkholes and wildfires. All his can result in releases of CO₂, CH₄, N₂O, soot, etc., which in turn causes further warming, specifically over the Arctic.
In total, a temperature rise of 10°C threatens to occur in as little as a few years time.
The situation is dire and calls for comprehensive and effective action, as described in the Climate Plan.
Links
• Jet Stream Center-of-Rotation to Shift 17 degrees Southward from North Pole to Greenland with Arctic Blue Ocean Event
https://www.youtube.com/watch?v=bFme3C9e-cs
• It could be unbearably hot in many places within a few years time
https://arctic-news.blogspot.com/2016/07/it-could-be-unbearably-hot-in-many-places-within-a-few-years-time.html
• Feedbacks
https://arctic-news.blogspot.com/p/feedbacks.html
• Latent Heat
https://arctic-news.blogspot.com/p/latent-heat.html
• Albedo and more
https://arctic-news.blogspot.com/p/albedo.html
• Warning of mass extinction of species, including humans, within one decadehttps://arctic-news.blogspot.com/2017/02/warning-of-mass-extinction-of-species-including-humans-within-one-decade.html
• How much warming have humans caused?
https://arctic-news.blogspot.com/2016/05/how-much-warming-have-humans-caused.html
• The Threat
https://arctic-news.blogspot.com/p/threat.html
• Extinction
https://arctic-news.blogspot.com/p/extinction.html
• Climate Plan
https://arctic-news.blogspot.com/p/climateplan.html
What will be the consequences of a Blue Ocean Event, i.e. the disappearance of virtually all sea ice from the Arctic Ocean, as a result of the warming caused by people?
Paul Beckwith discusses some of the consequences in the video below. As long as the Arctic Ocean has sea ice, most sunlight gets reflected back into space and the 'Center-of-Coldness' remains near the North Pole, says Paul. With the decline of the sea ice, however, the 'Center-of-Coldness' will shift to the middle of Greenland. Accordingly, we can expect the jet streams to shift their center of rotation 17° southward, i.e. away from the North Pole towards Greenland, with profound consequences for our global weather patterns and climate system, for plants and animals, and for human civilization, e.g. our ability to grow food.
Also see Paul's video below, The Arctic Blue-Ocean-Event (BOE). When? Then What?
Changing Winds

As global warming continues, the additional energy in the atmosphere causes stronger winds and higher waves.
As the Arctic warms up faster than the rest of the world, the jet streams are getting more out of shape, exacerbating extreme weather events.
The image on the right shows the jet stream crisscrossing the Arctic Ocean on September 10, 2018, with cyclonic wind patterns all over the place.
On the image below, Typhoon Mangkhut is forecast to cause waves as high as 21.39 m or 70.2 ft on September 14, 2018.

The inset on above image shows Typhoon Mangkhut forecast to cause winds to reach speeds as high as 329 km/h or 205 mph at 700 hPa (green circle), while Hurricane Florence is forecast to hit the coast of North Carolina, and is followed by Hurricane Isaac and Hurricane Helene in the Atlantic Ocean.

 At 850 hPa, Typhoon Mangkhut reaches Instant Wind Power Density as high as 196.9 kW/m² on September 13, 2018, as illustrated by above image.
The situation is likely to get worse over the next few months, as this is only the start of the hurricane season and El Niño is strengthening, as illustrated by the image on the right.
The image below shows how the occurrence and strength of El Niño has increased over the decades.

Four Arctic Tipping Points
There are numerous feedbacks that speed up warming in the Arctic. In some cases, there are critical points beyond which huge changes will take place rather abruptly. In such cases, it makes sense to talk about tipping points.
1. The albedo tipping point
As Arctic sea ice gets thinner and thinner, a Blue Ocean Event looks more imminent every year. A Blue Ocean Event means that huge amounts of sunlight won't get reflected back into space anymore, as they previously were. Instead, the heat will have to be absorbed by the Arctic.

At the other hemisphere, the sea ice around Antarctica is at its lowest extent for the time of the year, as illustrated by above image. Global sea ice extent is also at its lowest for the time of the year, as illustrated by the image below.

A Blue Ocean Event will not only mean that additional heat will have to be absorbed in the Arctic, but also that wind patterns will change radically and even more dramatically than they are already changing now, which will also make that other tipping points will be reached earlier. This is why a Blue Ocean Event is an important tipping point and it will likely be reached abruptly and disruptively.
2. The latent heat tipping point
 Disappearance of the sea ice north of Greenland is important in this regard. The image on the right shows that most sea ice at the end of August 2018 was less than 1 meter thick.
 The image below shows how the sea ice has been thinning recently north of Greenland and Ellesmere Island, an area once covered with the thickest multi-year sea ice. Disappearance of sea ice from this area indicates that we're close to or beyond the latent heat tipping point, i.e. the point where further ocean heat can no longer be consumed by the process of melting the sea ice.
 |
| [ The once-thickest sea ice has gone - click on images to enlarge ] |

Above image shows how much sea surface temperatures in the Arctic have warmed, compared to 1961-1990. The image also shows the extent of the sea ice (white). In the image below, a large area has changed from sea ice to water twelve days later, showing how thin and fragile the sea ice is and how easily it can disappear as the water continues to warm.

As the Arctic is warming faster than the rest of the world, changes have been taking place to the jet streams on the Northern Hemisphere that make it easier for warm air and water to move into the Arctic. This means that warm water is increasingly entering the Arctic Ocean that can no longer be consumed by melting the sea ice from below.
Arctic sea ice extent has remained relatively large this year, since air temperatures over the Arctic Ocean have been relatively low in June and July 2018. At the same time, ocean heat keeps increasing, so a lot of heat is now accumulating underneath the surface of the Arctic Ocean.
 |
| [ click on images to enlarge ] |
As said above, Arctic sea ice has been getting thinner dramatically over the years, and we are now near or beyond the latent heat tipping point.
 |
| [ The Buffer has gone, feedback #14 on the Feedbacks page ] |

As the temperature of the Arctic Ocean keeps rising, more heat threatens to reach sediments at its seafloor that have until now remained frozen. Contained in these sediments are huge amounts of methane in the form of hydrates and free gas.
Melting of the ice in these sediments then threatens to unleash huge eruptions of seafloor methane that has been kept locked up in the permafrost for perhaps millions of years. Seafloor methane constitutes a third tipping point.

The image on the right features a trend based on WMO data. The trend shows that mean global methane levels could cross 1900 ppb in 2019.
Ominously, methane recently reached unprecedented levels. Peak levels as high as 3369 ppb on August 31, 2018, as shown by the image below on the right.
The next image on the right below shows that mean global levels were as high as 1905 ppb on September 3, 2018.
 The third image below on the right may give a clue regarding the origin of these unprecedented levels.
More methane will further accelerate warming, especially in the Arctic, making that each of the tipping points will be reached earlier.
 Less sea ice will on the one hand make that more heat can escape from the Arctic Ocean to the atmosphere, but on the other hand the albedo loss and the additional water vapor will at the same time cause the Arctic Ocean to absorb more heat, with the likely net effect being greater warming of the Arctic Ocean.
Additionally, more heat is radiated from sea ice into space than from open water (feedback #23).
How much warming could result from the decline of snow and ice cover in the Arctic?
As discussed, there will be albedo changes, there will be changes to the jet streams, and there will be further feedbacks, adding up to 1.6°C of additional global warming that could eventuate due to snow and ice decline and associated changes in the Arctic.
A further 1.1°C of warming or more could result from releases of seafloor methane over the next few years.
4. Terrestrial Permafrost Tipping Point
Additional warming of the Arctic will also result in further warming due to numerous feedbacks such as more water vapor getting into the atmosphere. Furthermore, more intense heatwaves can occur easier in the Arctic due to changes to jet streams. All this will further accelerate melting of the ice in lakes and in soils on land that was previously known as permafrost. This constitutes a fourth tipping point that threatens to add huge amounts of additional greenhouse gases to the atmosphere. Until now, the permafrost was held together by ice. As the ice melts, organic material in the soil and at the bottom of lakes starts to decompose. The land also becomes increasingly vulnerable to landslides, sinkholes and wildfires. All his can result in releases of CO₂, CH₄, N₂O, soot, etc., which in turn causes further warming, specifically over the Arctic.
In total, a temperature rise of 10°C threatens to occur in as little as a few years time.
The situation is dire and calls for comprehensive and effective action, as described in the Climate Plan.
Links
• Jet Stream Center-of-Rotation to Shift 17 degrees Southward from North Pole to Greenland with Arctic Blue Ocean Event
https://www.youtube.com/watch?v=bFme3C9e-cs
• It could be unbearably hot in many places within a few years time
https://arctic-news.blogspot.com/2016/07/it-could-be-unbearably-hot-in-many-places-within-a-few-years-time.html
• Feedbacks
https://arctic-news.blogspot.com/p/feedbacks.html
• Latent Heat
https://arctic-news.blogspot.com/p/latent-heat.html
• Albedo and more
https://arctic-news.blogspot.com/p/albedo.html
• Warning of mass extinction of species, including humans, within one decadehttps://arctic-news.blogspot.com/2017/02/warning-of-mass-extinction-of-species-including-humans-within-one-decade.html
• How much warming have humans caused?
https://arctic-news.blogspot.com/2016/05/how-much-warming-have-humans-caused.html
• The Threat
https://arctic-news.blogspot.com/p/threat.html
• Extinction
https://arctic-news.blogspot.com/p/extinction.html
• Climate Plan
https://arctic-news.blogspot.com/p/climateplan.html