High temperatures hit Pakistan end May 2017. The image below shows readings as high as 51.1°C or 123.9°F on May 27, 2017 (at green circle).
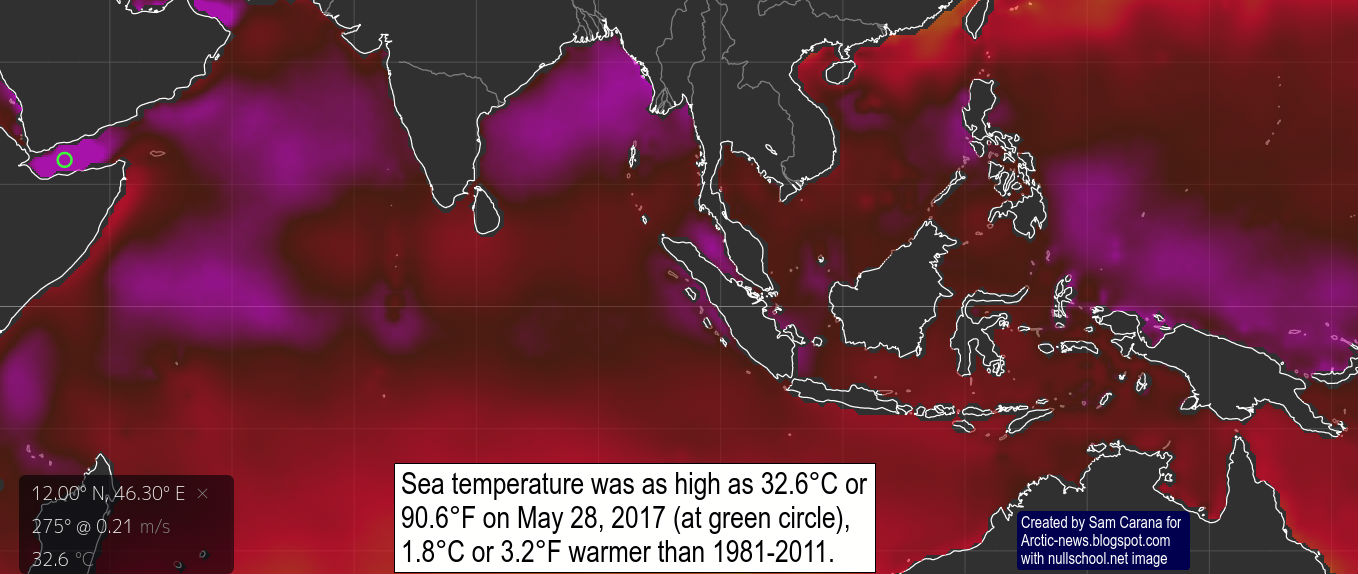
As the image below shows, sea temperature was as high as 32.6°C or 90.6°F on May 28, 2017 (at the green circle), 1.8°C or 3.2°F warmer than 1981-2011.
High temperatures over land and at the sea surface reflect an atmosphere that contains huge amounts of energy. On May 28, 2017, the Convective Available Potential Energy (
CAPE) reached levels as high as 7448 J/kg at the location in the United States marked by the green circle. Storms hit a large part of the United States, with
baseball-sized hail reported on May 27, 2017.
Here's a
link to a reported 56 °C (132 °F) temperature recorded in Iran and here's
a link to an article describing a May 28, 2017, reading in Turbat, Pakistan, initially reported by the Pakistan Meteorological Department as 53.5°C (128.3°F) and later upgraded to 54.0°C (129.2°F.)

How could it be possible for growth of energy in the atmosphere to be accelerating, when CO₂ emissions from fossil fuels and industry (including cement production) have barely shown any recent growth, as discussed in an
earlier post and as
reported by EIA?
The image on the right depicts this possibility, while a
recent post discussed the following scenario:
Warmer water tends to form a layer at the surface that does not mix well with the water underneath, as
discussed before. Stratification reduces the capability of oceans to take up heat and CO₂ from the atmosphere. Less take-up by oceans of CO₂ will result in higher CO₂ levels in the atmosphere, further speeding up global warming.
Additionally,
93.4% of global warming currently goes into oceans. The more heat will remain in the atmosphere, the faster the temperature of the atmosphere will rise. This feedback can cause very rapid and strong global warming. as depicted on the image on the right and as also described as feedback #29 on the
feedbacks page.
With this in mind, forecasts of storms hitting the Arctic Ocean over the next few months look even more frightening.
Waves as high as 2.34 m or 7.7 ft are forecast to hit the Arctic Ocean on June 8, 2017, at the location marked by the green circle.
How is it possible for waves to get that high in a part of the Arctic Ocean that is surrounded by continents that act as shields against winds?
On June 8, 2017, temperatures are forecast to be as high as 40.6°C or 105.2°F near Phoenix, Arizona, and as high as 26.0°C or 78.7°F in Alaska, as the image below shows.
The image below shows that on June 12, 2017, temperatures as high as 35.1°C or 95.3°F were recorded over a river in Siberia that ends in the Lena River which in turn ends in the Arctic Ocean (left panel, green circle), while waves near Novaya Zemlya were recorded as high as 4.54 m or 14.9 ft (top right panel, green circle).
The image below shows that on June 6, 2017, temperatures on the coast of Hudson Bay (green circle) were as high as 31.6°C or 89°F.
Four cyclones are visible on the above image. Strong winds over the Arctic Ocean can cause high waves that can break up the sea ice and strengthen currents that are pushing warm water into the Arctic Ocean and sea ice out of the Arctic Ocean.

Update: Above image shows that on June 18, 2017, 03:00 UTC, temperatures were as high as 29.5°C or 85°F over a Siberian river ending in the Arctic Ocean (green circle). Cyclones were making warm air flow into the Arctic Ocean. The forecast for June 25, 2017, on the right shows that this situation is likely to persist for another week.
These stronger winds, currents and waves come at a time that the Arctic sea ice thickness is at record low, as illustrated by the image below on the right by
Wipneus and underneath by
Larry Hamilton.
Let's take a closer look at some further feedbacks that are at work behind the increasingly thinner ice, higher temperature, stronger wind and higher waves in the Arctic.

•
Sea Ice Decline - The snow and ice cover over the Arctic Ocean make that sunlight is reflected back into space (albedo loss). In the absence of this cover, the Arctic Ocean will absorb more heat. Furthermore, open oceans are less efficient than sea ice when it comes to emitting in the far-infrared region of the spectrum.
•
Buffer Loss - The snow and ice cover over the Arctic Ocean acts as a buffer, absorbing heat that in the absence of this buffer will have to be absorbed by the Arctic Ocean, as discussed in earlier posts such as
this one.

•
Jet Stream Changes - Rising temperatures in the Arctic are causing wind patterns to change, in particular the jet stream.
As a result, warm air can more easily get carried by wind from land over the Arctic Ocean.
The image on the right shows the Jet Stream on June 6, 2017. As temperatures over the Arctic rise faster than they do at the Equator, the jet stream becomes more wavy.
 |
| [ click on images to enlarge ] |
Instead of circumnavigating Earth in a straight and narrow band that keeps the cold air over the Arctic separate from warmer temperatures south of the jet stream, a more wavy jet stream enables more warm air to flow into the Arctic and more cold air to leave the Arctic.
Winds are particularly strong over oceans and, as the Atlantic Ocean keeps warming up, those winds can push more warm water into the Arctic Ocean, as discussed in an
earlier post. This can dramatically warm up the water of the Arctic Ocean.
•
Clouds and Water Vapor - Loops of the jet stream extending over the Arctic can also bring stronger winds and more clouds and water vapor into the Arctic.
 |
| [ forecast for jet stream, June 8, 2017 ] |
This is another self-reinforcing feedback that goes hand in hand with the above feedbacks. As temperatures rise in the Arctic, loss of sea ice will increase, resulting in more open water. This, in combination with stronger winds and warmer water will also result in more clouds and water vapor over the Arctic, further speeding up the temperature rise in the Arctic.
•
Decline of Snow and Ice Cover on Land - Rising temperatures in the Arctic are also speeding up the decline of the snow and ice cover on land. This will result in albedo loss and will also trigger further feedbacks, such as soil destabilization and warm water from rivers flowing into the Arctic Ocean.
•
Soil destabilization - Heatwaves and droughts destabilize the soil. Soil that was previously known as permafrost, was until now held together by ice. As the ice melts, organic material in the soil starts to decompose and the soil becomes increasingly vulnerable to wildfires. All his can result in high emissions of CO₂, CH₄, N₂O, soot, etc., which in turn causes further warming, specifically over the Arctic. The danger of wildfires is illustrated by the image below.
•
Warmer Rivers - High temperatures on land can strongly warm up water of rivers flowing into the Arctic Ocean. This is also illustrated by the above image.
•
Seafloor Methane - Another huge dangers is that all this additional heat will reach the seafloor of the Arctic Ocean and will trigger destabilization of methane hydrates contained in sediments at the seafloor. Stronger winds can mix warmer water all the way down to the seafloor, and destabilize hydrates that can contain huge amounts of methane, resulting in release of huge quantities of methane into the atmosphere.
Meanwhile, an
earthquake with a magnitude of 5.2 on the Richter scale hit the Greenland Sea, in between Greenland and Svalbard, on June 9, 2017 at 20:49:52 UTC at 79.931°N, 0.605°E and at 18.4 km depth. On June 12, 2017, methane levels as high as 2740 ppb were recorded, as the image below shows. While the image doesn't specify where these high levels occurred, the magenta-colored area near Greenland looks ominous, also because such high levels do not typically result from biological releases, but instead point at concentrated plumes such as can occur when clathrates get destabilized.
The situation is dire and calls for comprehensive and effective action, as described in the
Climate Plan.
Links• Climate Plan
https://arctic-news.blogspot.com/p/climateplan.html• 10°C or 18°F warmer by 2021?
https://arctic-news.blogspot.com/2017/04/10c-or-18f-warmer-by-2021.html• Abrupt Warming - How Much And How Fast?
https://arctic-news.blogspot.com/2017/05/abrupt-warming-how-much-and-how-fast.html• Accelerating growth in CO₂ levels in the atmosphere
https//arctic-news.blogspot.com/2017/02/accelerating-growth-in-co2-levels-in-the-atmosphere.html • Feedbacks
https://arctic-news.blogspot.com/p/feedbacks.html• Warning of mass extinction of species, including humans, within one decade
https://arctic-news.blogspot.com/2017/02/warning-of-mass-extinction-of-species-including-humans-within-one-decade.html It's raining over the Arctic Ocean and the rain is devastating the sea ice. What are the conditions that led to this?


 Another indication of the strength of the wind driven through Bering Strait is wave height. On July 6, 2017, waves were as high as 3.35 m or 11 ft in the Bering Strait, at the location marked by the green circle on the image on the right.
 The combined impact of high temperatures, strong winds, high waves and warm river water, rain water and melt water looks set to further devastate what sea ice is left in the Arctic Ocean.