Damage from extreme weather events during 2017 racked up the biggest-ever bills for the U.S. Most of these events involved conditions that align intuitively with global warming: heat records, drought, wildfires, coastal flooding, hurricane damage and heavy rainfall.
Paradoxical, though, are possible ties between climate change and the recent spate of frigid weeks in eastern North America. A very new and “hot topic” in climate change research is the notion that rapid warming and wholesale melting of the Arctic may be playing a role in causing persistent cold spells.
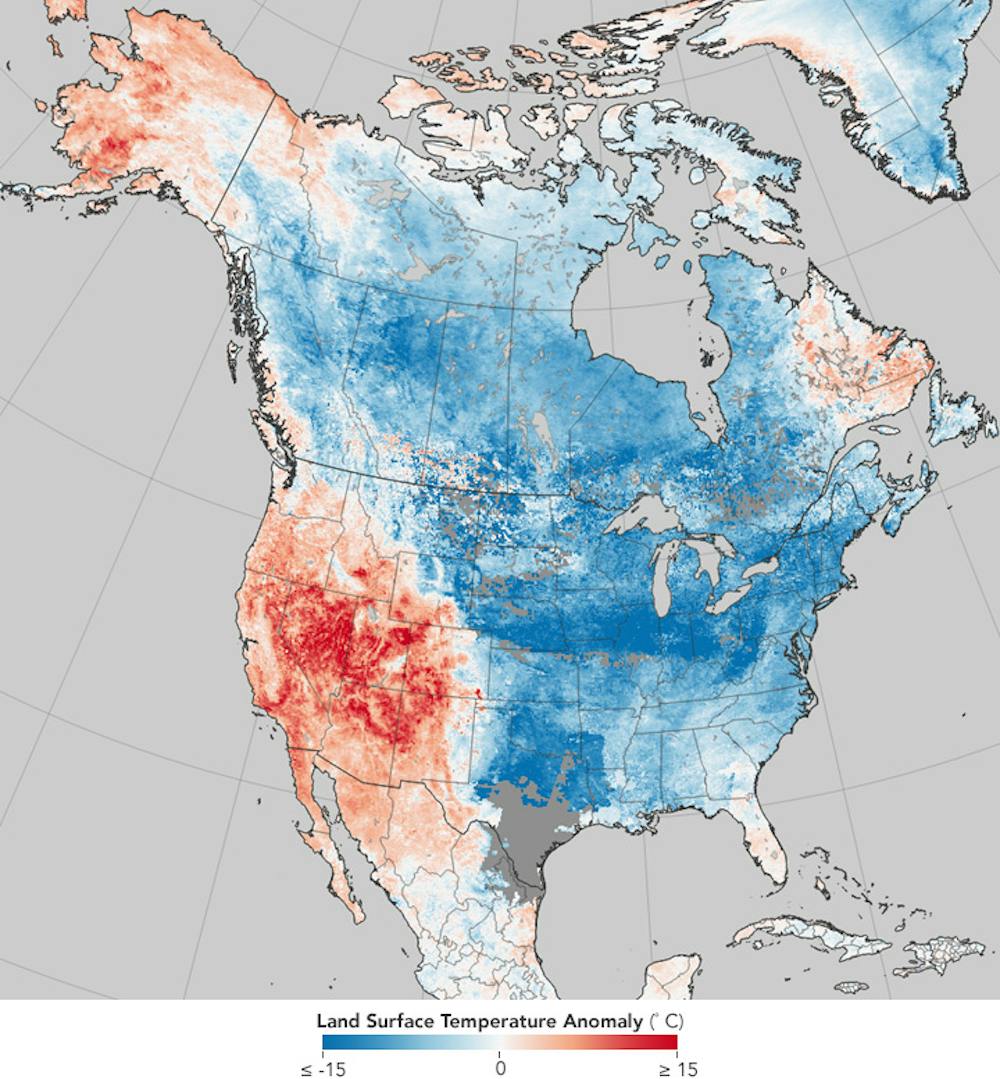
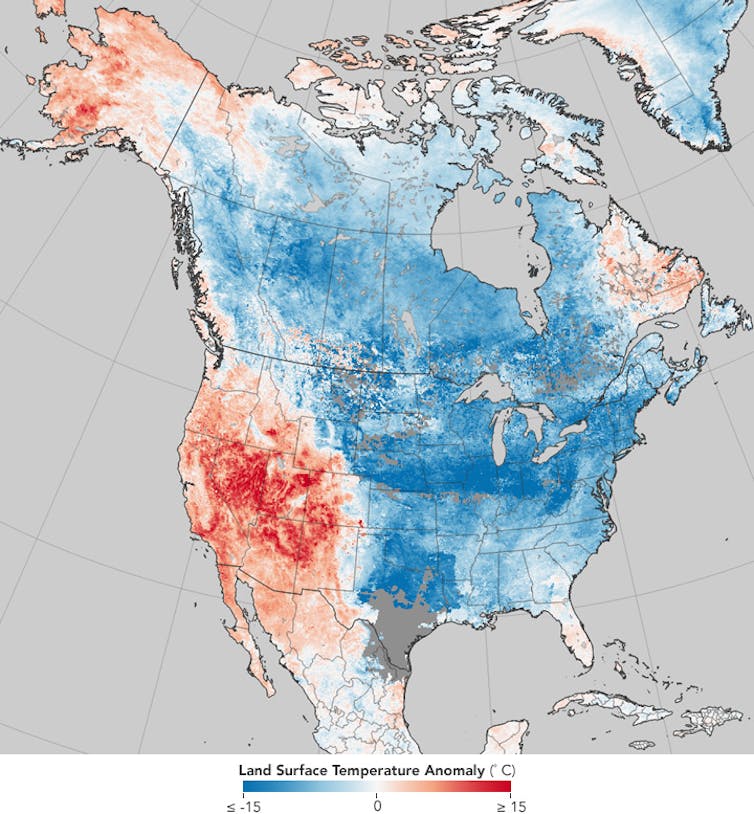
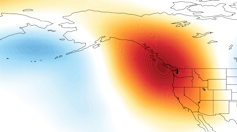
Weird and destructive weather was in the news almost constantly during 2017, and 2018 seems to be following the same script. Most U.S. Easterners shivered their way through the end of 2017 into the New Year, while Westerners longed for rain to dampen parched soils and extinguish wildfires. Blizzards have plagued the Eastern Seaboard – notably the “bomb cyclone” storm on Jan. 4, 2018 – while California’s Sierra Nevada stand nearly bare of snow. A study in contrasts: Warming near Alaska and the Pacific Ocean are ‘ingredients’ to a weather pattern where cold air from the Arctic plunges deep into North America. NASA Earth Observatory, CC BYThis story is becoming a familiar one, as similar conditions have played out in four of the past five winters. Some politicians in Washington D.C., including President Trump, have used the unusual cold to question global warming. But if they looked at the big picture, they’d see that eastern cold spells are a relative fluke in the Northern Hemisphere as a whole and that most areas are warmer than normal.
A warm, dry western North America occurring in combination with a cold, snowy east is not unusual, but the prevalence and persistence of this pattern in recent years have piqued the interests of climate researchers.
The jet stream – a fast, upper-level river of wind that encircles the Northern Hemisphere – plays a critical role. When the jet stream swoops far north and south in a big wave, extreme conditions can result. During the past few weeks, a big swing northward, forming what’s called a “ridge” of persistent atmospheric pressure, persisted off the West Coast along with a deep southward dip, or a “trough,” over the East.
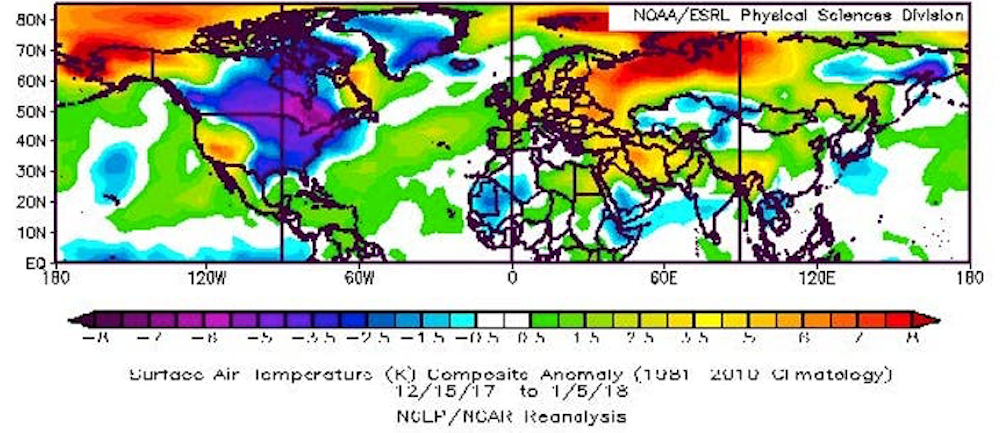
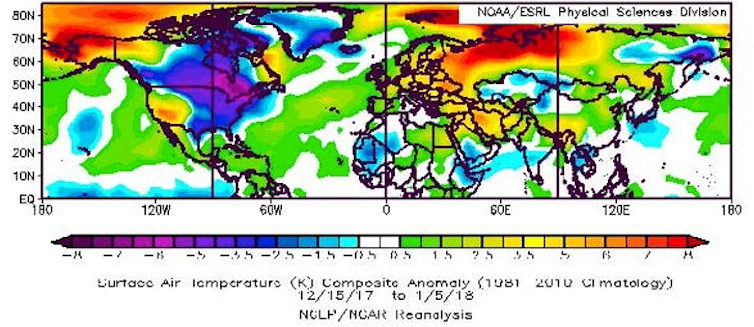
New terms have been coined to describe these stubborn features: “The North American Winter Temperature Dipole,” the “Ridiculously Resilient Ridge” over the West, and the “Terribly Tenacious Trough” in the East. While the eastern U.S. suffered very cold temperatures in the recent cold snap, much of the rest of the Northern Hemisphere saw higher-than-average air temperatures. NOAA, CC BY Regardless what it’s called, this dipole pattern – abnormally high temperatures over much of the West along with chilly conditions in the East – has dominated North American weather in four of the past five winters. January 2017 was a stark exception, when a strong El Niño flipped the ridge-trough pattern, dumping record-breaking rain and snowpack on California while the east enjoyed a mild month.
Two other important features are conspicuous in the dipole temperature pattern: extremely warm temperatures in the Arctic near Alaska and warm ocean temperatures in the eastern Pacific. Several new studies point to these “ingredients” as key to the recent years with a persistent dipole.
It takes two to tango
What role does warming – specifically the warming ocean and air temperatures in the Arctic – play in this warm-West/cool-East weather pattern? The explanation goes like this.
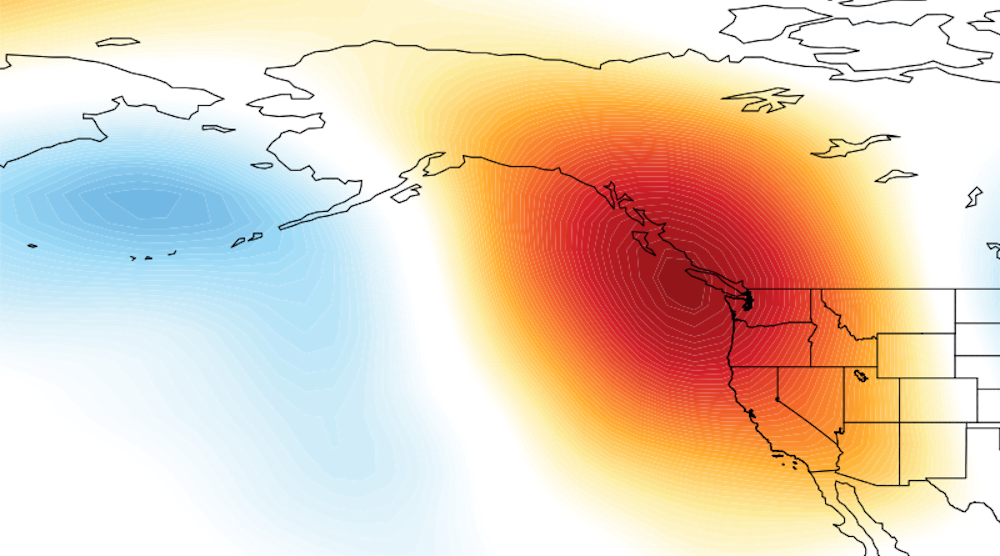
Pacific Ocean temperatures fluctuate naturally owing to short-lived phenomena such as El Niño/La Niña and longer, decades-length patterns. Scientists have long recognized that those variations affect weather patterns across North America and beyond. When a persistent area of atmospheric pressure stays in the western U.S., air from the Arctic pours into the U.S, causing a split between the warm and dry West and the cold East. Mesocyclone2014 and David Swain, CC BY-SA The new twist in this story is that the Arctic has been warming at at least double the pace of the rest of the globe, meaning that the difference in temperature between the Arctic and areas farther south has been shrinking. This matters because the north/south temperature difference is one of the main drivers of the jet stream. The jet stream creates the high- and low-pressure systems that dictate our blue skies and storminess while also steering them. Anything that affects the jet stream will also affect our weather.
When ocean temperatures off the West Coast of North America are warmer than normal, as they have been most of the time since winter 2013, the jet stream tends to form a ridge of high pressure along the West Coast, causing storms to be diverted away from California and leaving much of the West high and dry.
If these warm ocean temperatures occur in combination with abnormally warm conditions near Alaska, the extra heat from the Arctic can intensify the ridge, causing it to reach farther northward, become more persistent, and pump even more heat into the region near Alaska. And in recent years, Alaska has experienced periods of record warm temperatures, owing in part to reduced sea ice.
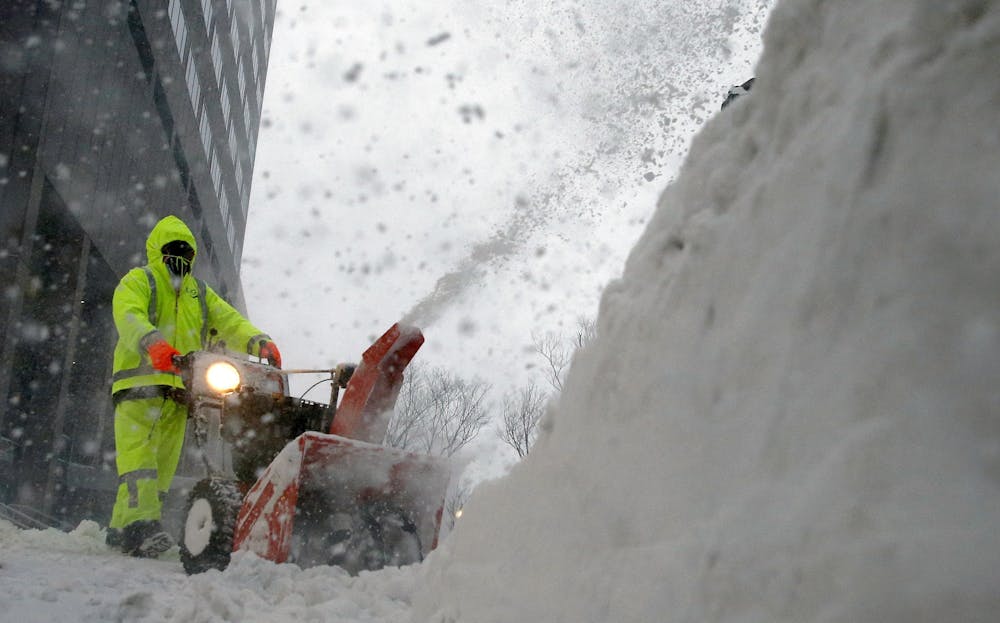
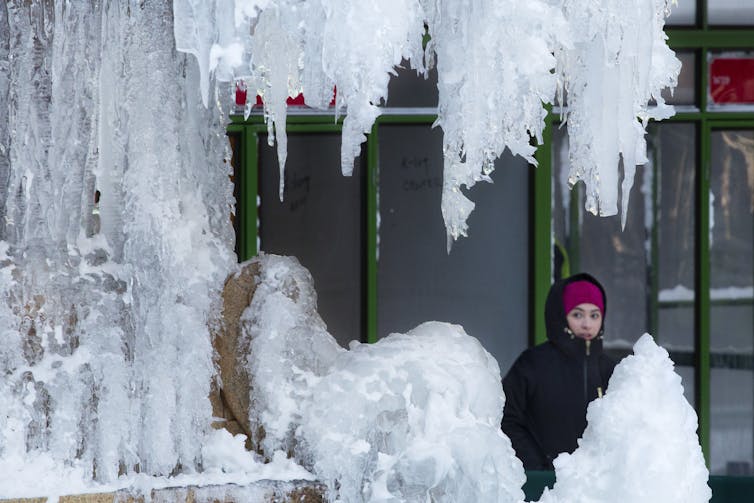
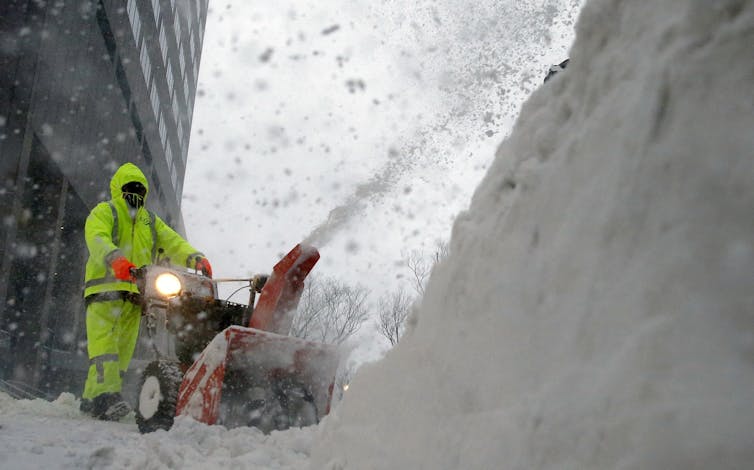
In response to the strengthened western ridge of atmospheric pressure, the winds of the jet stream usually also form a deeper, stronger trough downstream. Deep troughs act like an open refrigerator door, allowing frigid Arctic air to plunge southward, bringing misery to areas ill-prepared to handle it. Snowstorms in Texas, ice storms in Georgia and chilly snowbirds in Florida can all be blamed on the Terribly Tenacious Trough of December 2017 and January 2018. Cold weather from the Arctic combined with warm tropical air fueled a storm that produced well over a foot of snow and spots of flooding in Boston. AP Photo/Michael Dwyer Adding icing on the cake is the tendency for so-called “nor’easters,” such as the “bomb cyclone” that struck on Jan. 4, to form along the East Coast when the trough’s southwest winds align along the Atlantic Seaboard. The resulting intense contrast in temperature between the cold land and Gulf Stream-warmed ocean provides the fuel for these ferocious storms.
The big question is whether climate change will make dipole patterns – along with their attendant tendencies to produce extreme weather – more common in the future. The answer is yes and no.
It is widely expected that global warming will produce fewer low-temperature records, a tendency already observed. But it may also be true that cold spells will become more persistent as dipole patterns intensify, a tendency that also seems to be occurring.
It’s hard to nail down whether this weather pattern – overall warmer winters in North America but longer cold snaps – will persist. Understanding the mechanisms behind these complex interactions between natural influences and human-caused changes is challenging.
Nevertheless, research is moving forward rapidly as creative new metrics are developed. Our best tools for looking into the future are sophisticated computer programs, but they, too, struggle to simulate these complicated behaviors of the climate system. Given the importance of predicting extreme weather and its impacts on many aspects of our lives, researchers must continue to unravel connections between climate change and weather to help us prepare for the likely ongoing tantrums by Mother Nature.
Planning a week long hiking trip is fun, if you are an excel nerd, or maybe a chemist, or an outdoor enthusiast. Okay, never mind, it is actually fun no matter what! For me, planning is part of the package that makes up the perfect gift, a trip of a lifetime. I am not going to go into that here; you will be able to read more about that in part three, the trip report. For now, I will just say that the work that goes into something, be it the planning or the hiking or the sweat and the tears, or the cold nights and long days, makes the reward all that much more sweet.
The Plan: So the first thing I had to do was figure out where I wanted to go. I had been wanting to hike the Sierra High Route (SHR), which is an off trail route in the Sierras, for some time. However, it is about 200 miles long and at my estimate, I could hike about 20 miles per day, which would put me at 10 days, or too many days to do the trip on a one week vacation. So I looked for other options and found the Wind River High Route (WRHR), which is in the Wind River Range of Wyoming, very close to Jackson, Yellowstone and the Tetons. However, I will admit, I had never heard of this section of the Rockies before. However, this route, which was also off trail, was closer to 100 miles, which I figured I could do in one week. So, I invited my ultrarunning friend Dr. G and the planning began.
The Route: We used the Andrew Skurka guide, along with CalTopo maps and the app "Offline Maps" which has USGS topo maps that you can download to use offline. Skurka gives you a few GPS way points but the route is not mapped out for you. Dr. G loaded the waypoints into the Offline Maps as well. We also had a compass and paper topographical maps.
The Big Three: Next, it was time to get my gear list together. Luckily, I have a skeleton list already made out for other trips, so that part was not too much reinventing the wheel. However, this time, I wanted to finally buy some of those elusive lightweight items that had been on my wish list for so long. The main one was a sleeping bag. They say that there is a "big three" of hiking: the sleeping bag, the sleeping pad and the tent. These items, aside from food, are generally the heaviest in your pack. I had been shopping around for a lightweight but not super expensive sleeping bag for years and had even bought one once which turned out to not be warm enough. This time I bit the bullet and spent a little more in the hopes that this time I would have the sleeping bag of my dreams (see how I did that?)
I bought the following and will likely review them at some point: Western Mountaineering Ultralite 20 degree sleeping bag (29 oz), Hyperlite 2400 Southwest Backpack (28.6 oz), and the Therm-a-Rest NeoAir Xlite Small size (8 oz). Dr. G carried a two man tent, which weighed about 2 lbs (32 oz). Therefore, my big three + my backpack only weighed about 4 lbs, or if you include the weight I carried to compensate for not carrying the tent, it was about 5 lbs. To put it in perspective, my old backpack, which I love and have used a lot, weighs about 5.5 lbs empty. Yes, I said empty!
The Clothing: For clothing, my plan was to wear the following: running shorts, short sleeved running shirt, underwear, bra, socks and Saucony trail running shoes (Nomad). I would carry the following: Mountain Hardware windbreaker, long sleeved running shirt, Montbell rain jacket, rain pants, beanie, buff, gloves, MH down jacket, sleeping shirt (long sleeved), NorthFace tights, extra underwear, socks & bra. All of the clothing I carried (not counting clothing worn) weighed about 39 oz or 2.5 lbs.
The Other Stuff: I also had to bring toiletries, kitchen items (pot, pan, spoon, bowl, fuel, matches etc.), first aid, dry bags, water purifier, electronics (phone, charger, headlamp, camera etc.) and other utility items (knife, rope, compass, trash bag, whistle etc.). All together these weighed about 4 lbs.
Base Pack Weight: This is all things, excluding consumables, which include food, water and fuel. My goal was to keep this weight under 20 lbs, as I estimated food would be about 1.7 lbs per day x 6 days, which would be about 10 lbs, and I wanted to keep my pack under 30 total lbs. My total base weight ended up being about 11.5 lbs!! I was very excited about this.
The Food: This was the most fun but definitely the most time consuming portion of the planning. Oh my, I just said "portion." Ha. Seriously though, the goal is to carry the most amount of calories in the least amount of weight. We planned to try to have approximately 3,000 calories per day worth of food, which would hopefully be no more than 1.7 lbs per day. This sounds easy, right? You just load up your pack with Top Ramen and PowerBars, right? Nah. My goal was to have food that: (1) is nutritious, (2) tastes good, (3) is inexpensive (no $8 Mountain House meals), (4) can just have hot water added to it to cook and that (5) has some variety.
So I did a lot of weighing and calorie counting and math and came up with this food plan: Breakfast consisted of either muesli or oatmeal with milk, nuts and freeze dried fruit. Both were about 700 calories. There would also be coffee, with powdered milk and sugar, which would be about 80 - 100 calories. Lunch and snacks would consist of various nuts, bars, jerky, and dried fruit and would consist of about 1,200 - 1,600 calories per day. Dinner would consist of a curried top ramen dish, a mashed potato with bacon dish or a rice and beans dish, each clocking in at a little over 700 calories. I also brought olive oil to supplement, which is about 100 calories per serving. All in all, the goal was about 2,600 - 3,000 calories per day.
The H2O: I brought a 1.5L bladder and a 0.5L soft flask for water. Each liter of water weighs about 2 lbs, but my plan was to try to carry the least amount possible and fill up frequently, so as to keep the pack weight down.
Total Pack Weight: My food ended up being about 1.4 lbs per day. This, plus an estimated liter of water, would bring my total starting pack weight to about 23 total lbs. HOWEVER...Dr. G carried the tent and I carried some of his food, which brought my total up by about 4.5 lbs bringing my actual starting pack weight to 27.5 lbs.
The Verdict: This is the lightest I have ever been when doing a multi day backpacking trip. I lugged over 40 lbs up Mt. Whitney for a one night trip. I will (hopefully) never have to do that again. The pack felt comfortable and even when climbing up a steep rock or going through a tight squeeze, it was not too cumbersome.
A couple of things I would probably leave behind: the olive oil (it leaked plus we never used it), the all purpose soap (I did not shower, bathe, or use soap to do dishes or clean clothes like I thought I might), my sleeping shirt (I slept in my hiking clothes, although it is nice to have a possible dry shirt if needed), sports bra (I wore one and brought a spare and ended up wearing neither in the end) and my just-in-case tank top (it was never warm enough).
A couple of things I might bring some of / more of: gauze (I had tape but no gauze and I got a pretty big scrape which could have used a bit bigger of a cover), socks (I brought one spare but having wet feet is a pain), a different water carrying system (more on that in the trip report) and a different/newer charger (my solar charger is old and ran out of juice fast, plus it was not sunny so I could not recharge it).
A couple of things I could not have lived without: this Picaridin bug lotion (NO bug bites when applied, even with mosquitoes SWARMING), Advil, Neosporin / Bandaids / Leukotape (as mentioned above, I got a scrape and it was nice to have something to clean it), earplugs (my tentmate was a snorer, plus the sleeping pads are loud) my new sleeping bag (fabulous! We spent one night in a snowstorm and I was not cold at all), maps/compass/GPS (after all, this was an off trail trek), Garmin 910ST, camera (I took about 800 photos), Yaktrax (I almost left them behind), and nuts (fat, protein and carbs all rolled into one, which keeps you feeling more full throughout the day).
In the end, I ate every speck of my food, except for the olive oil and one packet of Justin's Peanut Butter. I also used everything in my bag, except for the few things mentioned above and any emergency items (rope, knife, first aid). There was nothing that I really missed or really felt was dead weight. I felt that the packing ended up being pretty much perfect. I may try to compress a few things down a bit more with a compression sack so I can fit a little more if I am hiking for more days. I also need to figure out my water system and probably configure one extra pocket on the front of my pack (my pack has two hip pockets but no chest pocket). Otherwise, things are looking pretty good!
Have you ever planned for a long hiking or backpacking trip? Or maybe a long vacation? What is your logistical planning strategy?
At the beginning of this month my friend Dr. G and I went hiking in the Wind River Range in Wyoming. It was hard for us to find online information regarding weather etc., so my trip report is going to consist of three parts: (1) Weather Report / Trail Conditions, (2) Logistics and (3) Trip Report. This way if anyone needs trail info, they will hopefully be able to find it here. If you are reading this and don't plan on hiking, you can skip part one and wait until part two or three come out!
A taste of what's to come
I will go into this in more detail later, but most of our hike consisted of traveling on the semi-charted and very informal "Wind River High Route." (See here for the Skurka version or the Wilson/Dixon version) Described by Andrew Skurka as being approximately 66% off trail, it consisted of a lot of boulder hopping, stream fording, snowfield crossing, bushwhacking and route finding. This was a huge challenge as well as being a lot of fun. However, there were some things that it would have been nice to know beforehand. First and foremost, there was A LOT more snow than I expected. Most of the route is above 10,500 feet and much of it is even in the 12,000 foot plus range. I knew there would be some snow; I knew this year was more snowy than others have been. However, there was still even more snow that I expected even after taking certain factors into consideration. I brought Yaktrax and Dr. G had micro-spikes and we used them a lot! However, depending on your expertise, I would even say that some sections warranted crampons/ice axes or at least trekking poles, especially if you are inexperienced or faint at heart.
Wilson/Dixon descending the south side of Alpine Lakes Pass in 2013 (source)
Dr. G ascending the south side of Alpine Lakes Pass Aug 2017
Dr. G ascending the south side of Alpine Lakes Pass Aug 2017 (he is the tiny speck beyond the tiny rock)
Foodwise, I ate ALL of my food. When the hike was done, I had one packet of peanut butter (180 calories) left over. I had eaten every other scrap of food that I brought. I will go into more detail about this in the logistics portion of this series, but basically my takeaway is that I forgot how much the altitude and constant movement can burn up those calories! In addition, of the seven days we hiked, five of them had rain, hail or snow. One night, as we were camping at about 11,000 feet, we got snowed on and woke up to the sound of the snow sliding off the top of the tent to the ground. The next day there was a beautiful layer of new snow, which was priceless, but it was hard to see the rocks underneath to see where to step or to determine where the best path was. Needless to say, I wore pretty much everything that I brought, even the "just in case" layers, and I was mighty glad to have bought a new sleeping bag before setting out. Also, if you do not have a waterproof backpack, I suggest dry bags or at the very least a trash bag pack liner.
Rainy but never gloomy!
New snow! Beautiful but hard to get traction! Looking north from Europe peak.
Due to the above and probably other things such as route finding errors and variability of the route in general, the hike took us a lot longer than expected. The total route is supposed to be 96 miles, so we thought it realistic that we would take five or maybe six days to complete the route. However, due to a few wrong turns and snowy days, it took us seven days, we only averaged about 15 miles per day AND ended up with a total route distance of 114 miles. If you have any questions, I am happy to answer them!
For my normal readers, have you ever gone off trail when hiking? Have you ever heard of the Wind River Range?
The weather is getting more and more extreme. On April 23, 2016, temperatures in India were as high as 47.7°C or 117.9°F. At the same time, temperatures in California were as low as -12.6°C or 9.2°F, while temperatures in Greenland were as high as 3.6°C or 38.6°F. Meanwhile, Antarctica was as cold as -60°C or -76°F.
The situation in India is most worrying. Temperatures are very high in many locations. India has been experiencing heatwave conditions for some time now, as reported in this and in this earlier posts.
[ click on images to enlarge ]
More extreme weather goes hand in hand with changes that are taking place to the jet stream, as also discussed in earlier posts (see further below).
As the Arctic warms up more rapidly than the rest of the world, the temperature difference between the Equator and the North Pole decreases, which in turn weakens the speed at which the north polar jet stream circumnavigates the globe. This is illustrated by the wavy patterns of the north polar jet stream in the image on the right.
The outlook for the next week shows the north polar jet stream move higher over the arctic, and to eventually disintegrate altogether, while merging with the subtropical jet stream over the Pacific Ocean.
The video below shows how a very wavy jet stream is projected to disintegrate over the Arctic Ocean over the coming week.
This makes it easier for warm air to move into the Arctic and for cold air to move out of the Arctic, in turn further decreasing the temperature difference between the Equator and the North Pole, in a self-reinforcing feedback loop: "It's like leaving the freezer door open."
Temperature forecasts for the Arctic Ocean are high, with anomalies projected to be above 4°C for the Arctic over the coming week.
The image on the right shows one such forecast, projecting a temperature anomaly of 5.31°C or 9.56°F for the Arctic on April 27, 2016, 1500 UTC, while an earlier forecast projected a 5.34°C or 9.61°F anomaly (hat tip to Mark Williams).
The danger is that the combined impact of high air temperatures and ocean heat will cause rapid demise of Arctic sea ice over the next few months.
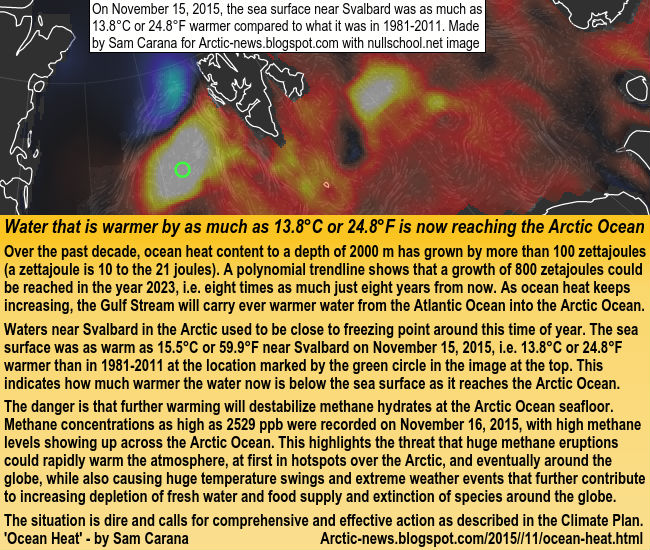
On April 22, 2016, the sea surface was as much as 11.3°C or 20.3°F warmer than 1981-2011 (at the location off the coast of North America marked by the green circle).
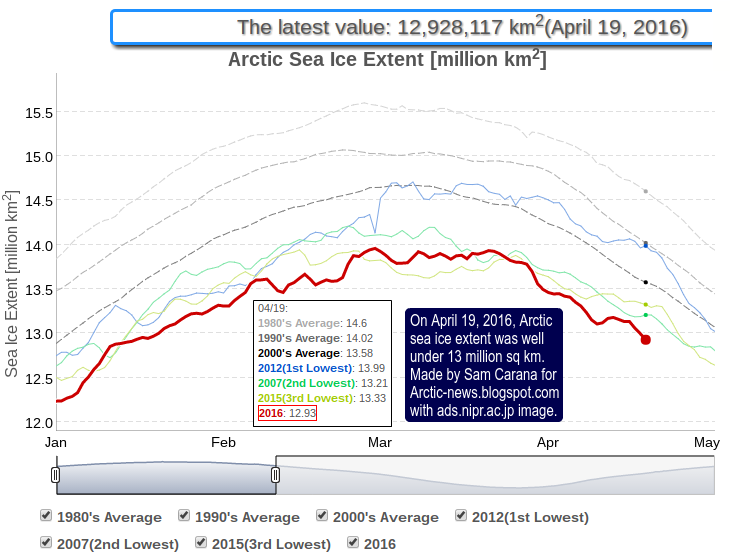
High ocean heat is further accelerating Arctic sea ice demise, as the Gulf Stream keeps carrying ever warmer water into the Arctic Ocean. The image below, created with an image from the JAXA site, shows that Arctic sea ice extent was well under 13 million km2 on April 19, 2016, and about 1 million km2 less than the extent in the year 2012 around this time of year.
Demise of the sea ice will cause even more rapid warming of the Arctic Ocean, with the danger that more heat will penetrate sediments that contain huge amounts of methane in the form of hydrates and free gas, threatening to trigger huge methane releases and cause runaway warming.
Methane levels are increasing strongly. This may not be as noticeable when taking samples from ground stations, but the rise is dramatic at higher altitudes, as also discussed earlier in this post and in this post.
Methane levels in ppb (parts per billion, at bottom of image)
The conversion table below shows the altitude equivalents in feet, m and mb.
57016 feet
44690 feet
36850 feet
30570 feet
25544 feet
19820 feet
14385 feet
8368 feet
1916 feet
17378 m
13621 m
11232 m
9318 m
7786 m
6041 m
4384 m
2551 m
584 m
74 mb
147 mb
218 mb
293 mb
367 mb
469 mb
586 mb
742 mb
945 mb
The situation is dire and calls for comprehensive and effective action, as described at the Climate Plan.
The year 2015 is shaping up to be the warmest year on record. In the media, a lot of attention has been given to the many floods, droughts, wildfires and heatwaves that have battered the world this year.
Sadly, though, little attention is given to the situation in the Arctic. The image on the right shows a forecast for December 30, 2015, with temperatures at the North Pole above freezing point, as further illustrated by the nullschool.net image below, showing a temperature forecast of 1.1°C or 34.1°F for the North Pole. Wind speed at the North Pole is forecast to be 105 mph or 168 km/h on December 30, 2015, and 133 mph or 215 km/h closer to Svalbard.
As the image below illustrates, very high temperatures are forecast to hit the Arctic Ocean on December 30, 2015.
Above image shows temperature anomalies at the highest end of the scale for most of the Arctic Ocean, with a temperature anomaly for the Arctic as a whole of 2.4°C or 4.32°F above what was common in 1979-2000. The situation isn't likely to improve soon. For January 3, 2016, the temperature in the Arctic is forecast to be as much as 4.56°C or 8.21°F warmer.
How is it possible for such high temperatures to occur over the Arctic Ocean? The image below shows how the year 2015 is shaping up in terms of temperature anomalies.
Global warming is felt most strongly in the Arctic as warming continues, as illustrated by above image and by the image on the right.
Warming in the Arctic is accelerating due to feedbacks. One of these feedbacks is the way the jet streams are changing. Changes in the jet streams are becoming more prominent as the Arctic is warming up more rapidly than the rest of the world.
As the difference in temperature between the Arctic and the equator becomes smaller, the speed at which the jet stream circumnavigates the globe is decreasing and jet streams become more wavy.
Meanwhile, most of the extra heat caused by global warming goes into the oceans, and the Atlantic Ocean is warming up fast. At the same time, meltwater is accumulating at the surface of the North Atlantic, lowering sea surface temperatures there. With such large differences between high temperatures over North America and lower temperatures over the North Atlantic, the speed of the jet stream between those places can increase dramatically.
The result is that huge amounts of warm air are being pushed high into the Arctic. The image on the right shows the jet streams on December 27, 2015, when speeds as high as 263 mph or 424 km/h were reached at the location marked by the green circle. Also note the jet streams crossing the Arctic at the top of the image, while crossing the equator at the bottom of the image.
The image below shows sea surface temperature anomalies on the Northern Hemisphere in November.
For over a month now, storms over the North Atlantic have been pushing hot air high up into the Arctic. The video below uses surface wind content by Climate Reanalyzer (selected daily averages and sequences of forecasts) to cover the period from December 5, 2015, to January 8, 2016.
Best wishes for 2016
Above video stops at January 8, 2016, when two cyclones are visible, one in the North Atlantic and another one over the North Pacific, prompting me to create the image on the right.
What causes these storms to grow this strong? Waters keeps warming up dramatically off the east coast of North America. Emissions from North America tend to extend over these waters, due to the Coriolis effect, and this contributes to their extreme warming.
The image below shows carbon dioxide levels as high as 511 ppm over New York on November 5, 2015, and as high as 500 ppm over the water off the coast of coast of New Jersey on November 2, 2015.
Emissions contribute to warmer waters - click to enlarge
The top panel of the image on the right shows that on December 11, 2015, carbon dioxide levels were as high as 474 ppm (parts per million, surface concentration) at the location marked by the green circle in New York.
The bottom panel of the image on the right shows that the water off the coast was warmer by as much as 10.3°C or 18.5°F at the location marked by the green circle on December 11, 2015.
The NASA video below shows carbon dioxide emissions over the year 2006.
It's not just CO2 off the North American coast that contributes to further warming of the Gulf Stream, many other emissions do so, including methane, CO, etc. Carbon monoxide (CO) is not a greenhouse gas, but it depletes hydroxyl, thus preventing oxidation of methane, a very potent greenhouse gas. The animation below shows a carbon monoxide level at green circle of 528 ppb on December 28, 2015, 0900z, while the sea surface temperature anomaly there was 15.8°F or 8.8°C on that day.
Carbon monoxide reached much higher levels recently over land, as illustrated by the image below that shows a CO level of 2077 ppb in New York on January 6, 2016.
These emissions heat up the Gulf Stream and make that ever warmer water is carried underneath the sea surface all the way into the Arctic Ocean, while little heat transfer occurs from ocean to atmosphere, due to the cold freshwater lid on the North Atlantic.
The image on the right shows that it was warmer by as much as 9.6°C or 17.2°F near Svalbard on December 25, 2015, at the location marked by the green circle. The same anomalies were recorded on December 26, 2015, when the temperature of the water there was 11°C or 51.9 °F.
This gives an indication of how warm the water is that is being pushed underneath the sea surface into the Arctic Ocean.
Strong winds and high waves can cause more sea ice to be pushed along the edges of Greenland out of the Arctic Ocean, into the Atlantic ocean, expanding the cold freshwater lid on the North Atlantic, in a self-reinforcing feedback loop.
The image below shows the impact of these storms on sea ice speed and drift on December 31, 2015 (left) and a forecast for January 8, 2016 (right).
The danger is that, as warmer water reaches the seafloor of the Arctic Ocean, it will increasingly destabilize sediments that can contain huge amounts of methane in the form of free gas and hydrates.
Methane levels over the Arctic Ocean are already very high. Above image shows methane levels as high as 2745 ppb over the Arctic Ocean on January 2, 2016. High releases from the Arctic Ocean seafloor are pushing up methane levels higher in the atmosphere, as discussed in earlier posts such as this one.
So, while the extreme weather events that have occurred in the year 2015 are frightening, even more terrifying is the way the water of the Arctic Ocean is warming up. Sadly, this is rarely even discussed in the media. So, let's once more add the image below that should have been given more media attention.
The situation is dire and calls for comprehensive and effective action as described at the Climate Plan.
The year 2015 is shaping up to be the warmest year on record. In the media, a lot of attention has been given to the... Posted by Sam Carana on Monday, December 28, 2015
 Nevertheless, research is moving forward rapidly as creative new metrics are developed. Our best tools for looking into the future are sophisticated computer programs, but they, too, struggle to simulate these complicated behaviors of the climate system. Given the importance of predicting extreme weather and its impacts on many aspects of our lives, researchers must continue to unravel connections between climate change and weather to help us prepare for the likely ongoing tantrums by Mother Nature.