The image below shows Arctic sea ice extent, with the blue dot indicating that extent for August 30, 2015, was 4.804 million square kilometers. Satellite records shows that, at this time of the year, extent was only lower in 2007, 2011 and 2012.

There are a number of reasons why sea ice looks set to decrease dramatically over the next few weeks. On above image, extent for 2015 looks set to soon cross the lines for the years 2007 and 2011, while the sea ice today is in an even worse condition than one might conclude when looking at extent alone.
Thick sea ice is virtually absent compared to the situation in the year 2012 around this time of year, as illustrated by the image below that compares sea ice thickness on August 30, 2012 (left) with August 30, 2015 (right).

 Furthermore, sea surface temperatures are very high. The North Pacific, on August 31, 2015, was about 1°C (1.8°F) warmer than it was compared to the period from 1971 to 2000, as illustrated by the Climate Reanalyzer image on the right.
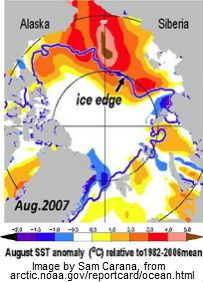
As the image below shows, sea surface temperature anomalies are very high around North America, both in the Pacific Ocean and in the Atlantic Ocean.
The image below shows sea surface temperatures on August 30, 2015, indicating that a huge amount of ocean heat has accumulated in the Atlantic Ocean off the coast of North America.

The Gulf Stream is carrying much of this warm water toward the Arctic Ocean. Additionally, warm water from the Pacific Ocean is entering the Arctic Ocean through the Bering Strait.

Above image below shows sea surface temperature anomalies in the Arctic as at August 31, 2015.


There still are a few weeks to go before sea ice can be expected to reach its minimum, at around half September 2015, while sea currents will continue to carry warmer water into the Arctic Ocean for months to come.
There is a strengthening El Niño, while more open water increases the chance that storms will develop that will push the last remnants of the sea ice out of the Arctic Ocean, as discussed in earlier posts such as this one. Storms can also mix warm surface waters all the way down to the seafloor, as discussed in this earlier post. Typhoons increase this danger. The above image show three typhoons in the Pacific Ocean on 30 August, 2015, and the Climate Reanalyzer image on the right shows them on September 1, 2015.
These typhoons are headed in the direction of the Arctic. The Climate Reanalyzer forecast for September 8, 2015, below shows typhoons in the Pacific Ocean close to the Arctic Ocean, as well as strong wind over the Arctic Ocean.

The situation is dire and calls for comprehensive and effective action, as discussed in the Climate Plan.

There are a number of reasons why sea ice looks set to decrease dramatically over the next few weeks. On above image, extent for 2015 looks set to soon cross the lines for the years 2007 and 2011, while the sea ice today is in an even worse condition than one might conclude when looking at extent alone.
Thick sea ice is virtually absent compared to the situation in the year 2012 around this time of year, as illustrated by the image below that compares sea ice thickness on August 30, 2012 (left) with August 30, 2015 (right).
 Furthermore, sea surface temperatures are very high. The North Pacific, on August 31, 2015, was about 1°C (1.8°F) warmer than it was compared to the period from 1971 to 2000, as illustrated by the Climate Reanalyzer image on the right.
 As the image below shows, sea surface temperature anomalies are very high around North America, both in the Pacific Ocean and in the Atlantic Ocean.
The image below shows sea surface temperatures on August 30, 2015, indicating that a huge amount of ocean heat has accumulated in the Atlantic Ocean off the coast of North America.

The Gulf Stream is carrying much of this warm water toward the Arctic Ocean. Additionally, warm water from the Pacific Ocean is entering the Arctic Ocean through the Bering Strait.


There still are a few weeks to go before sea ice can be expected to reach its minimum, at around half September 2015, while sea currents will continue to carry warmer water into the Arctic Ocean for months to come.
There is a strengthening El Niño, while more open water increases the chance that storms will develop that will push the last remnants of the sea ice out of the Arctic Ocean, as discussed in earlier posts such as this one. Storms can also mix warm surface waters all the way down to the seafloor, as discussed in this earlier post. Typhoons increase this danger. The above image show three typhoons in the Pacific Ocean on 30 August, 2015, and the Climate Reanalyzer image on the right shows them on September 1, 2015.
These typhoons are headed in the direction of the Arctic. The Climate Reanalyzer forecast for September 8, 2015, below shows typhoons in the Pacific Ocean close to the Arctic Ocean, as well as strong wind over the Arctic Ocean.

The situation is dire and calls for comprehensive and effective action, as discussed in the Climate Plan.
Thick sea ice is virtually absent compared to the situation in the year 2012 around this time of year....
Posted by Sam Carana on Tuesday, September 1, 2015