Showing posts with label heat. Show all posts

Dangerous situation in Arctic

In the North Pacific, the flow of warmer water is clearly visible (see images right, green circle left).

In the North Atlantic, huge amounts of heat are moving into the Arctic Ocean (green circle right).

At some spots, heat that is traveling underneath the sea surface comes to the surface (green circle at the top).

Most warming caused by people's emissions goes into oceans, especially into the top layer of oceans.

Furthermore, warmer air and warmer sea surfaces can cause winds to grow dramatically stronger. As the Arctic is warming much faster than the rest of the world, the narrowing difference between the temperatures at the North Pole and the Equator is decreasing the speed at which winds circumnavigate Earth; at the same time, the amount of heat that is moving north can grow dramatically, both due to winds and sea currents, and cyclones can further accelerate this.

The danger is that an influx of warm salty water will reach the seafloor and trigger methane eruptions.

The situation is especially critical in many parts of the Arctic Ocean where the water is very shallow. Some 75% of the East Siberian Arctic Shelf (ESAS) is shallower than 50 m (see maps on the right).
[ warm water from the Atlantic Ocean is
increasingly invading the Arctic Ocean ]


The danger here is huge, for numerous reasons, incl.:

• shallow waters can warm up very rapidly in case of an influx of warm water;

• these shallow seas are now covered by ice, so the heat cannot escape to the atmosphere;

• sea ice is very thin, so the sea ice won't act as a buffer to absorb the heat;

• methane rising through shallow waters will pass through the water column and enter the atmosphere more quickly;

• in shallow waters, large abrupt releases will more quickly deplete the oxygen in the water, making it harder for microbes to break down the methane;

• hydroxyl levels over the Arctic are very low, which means that it takes much longer for methane over the Arctic to get broken down.

The four videos below provide a good introduction into the various issues and illustrate how dangerous the situation is in the Arctic.

Each video is part of a talk between Dave Borlace and Peter Wadhams.

Part 1 discusses albedo change in the Arctic and associated changes such as jet stream changes.


Part 2 discusses the threat of huge methane releases in the Arctic.


Part 3 discusses the thermohaline circulation and methods that could improve the situation such as carbon removal and Ocean Mechanical thermal Energy Conversion (OMTEC).


Part 4 discusses sea level rise and fires.


The situation is dire and calls for comprehensive and effective action, as described at the Climate Plan, i.e. multiple lines of action implemented in parallel and locally where possible.


Links

• As El Niño sets in, will global biodiversity collapse in 2019?
https://arctic-news.blogspot.com/2018/11/as-el-nino-sets-in-will-global-biodiversity-collapse-in-2019.html

• Doomsday by 2021?
https://arctic-news.blogspot.com/2018/11/doomsday-by-2021.html

• Climate Plan
https://arctic-news.blogspot.com/p/climateplan.html

• Feedbacks
https://arctic-news.blogspot.com/p/feedbacks.html

• Extinction
https://arctic-news.blogspot.com/p/extinction.html

• Seismic Events
https://arctic-news.blogspot.com/p/seismic-events.html

• Can we weather the Danger Zone?
https://arctic-news.blogspot.com/2018/07/can-we-weather-the-danger-zone.html

• How much warmer is it now?
https://arctic-news.blogspot.com/2018/04/how-much-warmer-is-it-now.html

• What Does Runaway Warming Look Like?
https://arctic-news.blogspot.com/2018/10/what-does-runaway-warming-look-like.html

• Peaks Matter
https://arctic-news.blogspot.com/2018/08/peaks-matter.html

• Warning of mass extinction of species, including humans, within one decade
https://arctic-news.blogspot.com/2017/02/warning-of-mass-extinction-of-species-including-humans-within-one-decade.html


Peaks Matter

Heat stress

When calculating how much warmer we can expect it to get, climate models typically use linear projections based on temperature averages, such as annual global average temperatures, daily temperatures that are averages between day and night, etc. Sadly, this downplays the danger, as average temperatures are unlikely to kill people. When lives are at stake, peaks matter!

Where are temperatures rising most?


Temperatures are rising most strongly in the Arctic. Above map shows a rise of as much as 5.7°C or 10.26°F in Arctic.

Ocean heat on the move toward Arctic Ocean

The image below shows that the sea surface was 22°C or 71.6°F on August 13, 2018, at 77.958°N, 5.545°E (near Svalbard), i.e. 6.9°C or 12.4°F warmer than 47 days earlier and 16.4°C or 29.5°F warmer than it was during 1981-2011.


Local maximum temperatures can be good indicators for the maximum heat stress that can be expected in the area.


As illustrated by above image, the sea surface near Svalbard was 22°C or 69.2°F at the green circle, near Svalbard, on August 13, 2018, 16.4°C or 29.5°F warmer than 1981-2011.

This high sea surface temperature is an indicator of the temperature of the water below the surface, which in turn is an indicator of the amount of ocean heat that is entering the Arctic Ocean from the Atlantic Ocean.

Ocean heat is carried by the Gulf Stream from the North American coast toward the Arctic Ocean, as illustrated by the images below and on the right.

Warming of the Arctic Ocean comes with a number of feedbacks that accelerate this warming, such as albedo changes that take place as the Arctic snow and ice cover declines, and methane that is released from sediments containing methane in the form of hydrates and free gas.


The situation could get worse rapidly. As an example, with a decrease in cooling aerosols, which are concentrated in the Northern Hemisphere, the North Atlantic looks set to absorb more heat. A recent study calculated that the North Atlantic’s share of the uptake could increase from 6% to about 27%.

As another example, a recent study concludes: Existing models currently attribute about 20% of the permafrost carbon feedback this century to methane, with the rest due to carbon dioxide from terrestrial soils. By including thermokarst lakes, methane becomes the dominant driver, responsible for 70% to 80% of permafrost carbon-caused warming this century. Adding thermokarst methane to the models makes the feedback’s effect similar to that of land-use change, which is the second-largest source of manmade warming.

High methane levels warn about seafloor methane releases

The image on the right illustrates the danger, showing high methane levels at Barrow, Alaska, in July 2018.

When making projections of heat stress, it is important to look at all potential warming elements, including albedo changes, changes to jet streams and sea currents, higher levels of methane, high levels of water vapor, etc.

Methane is a potent greenhouse gas, causing huge warming immediately after entering the atmosphere, while this warming will be felt most strongly where the methane was released. Methane can therefore contribute strongly to local temperature peaks.

On August 6, 2018, mean global methane levels were as high as 1896 ppb. On August 8, 2018, they were as high as 1898 ppb.

Importantly, peak levels on the afternoon of August 6, 2018, were as high as 3046 ppb, as illustrated by the image on the right. The likely origin of those high levels is the Arctic Ocean, which should act as a stark warning of things to come.

Further contributors to heat stress

Next to temperature, humidity is of vital importance. A combination of high temperatures and high humidity is devastating.

A recent study shows that the risk of deadly heat waves is significantly increased because of intensive irrigation in specific regions. The study points at a relatively dry but highly fertile region, known as the North China Plain — a region whose role in that country is comparable to that of the Midwest in the U.S. That increased vulnerability to heat arises because the irrigation exposes more water to evaporation, leading to higher humidity in the air than would otherwise be present and exacerbating the physiological stresses of the temperature.

The image below shows a forecast of perceived temperatures in China on August 7, 2018.


The green circle highlights an area that is forecast to score high on the 'Misery Index' and that is centered around a location on the coast of Poyang Lake, which is connected to the Yangtze River. Temperatures there are forecast to be as high as 36.4°C or 97.4°F. At first glance, this may not look very high, but a relative humidity 68% is forecast to make it feel like 54.1°C or 129.3°F. This translates into a wet-bulb temperature of 31.03°C or 87.86°F.

The image on the right shows relative humidity. Also note the cyclones lined up on the Pacific Ocean. Cyclones can increase humidity, making conditions worse.
The high sea surface temperature anomalies that are common in the West Pacific (image right)  contribute to warmer air and stronger cyclones carrying more moisture toward Asia, as discussed in this facebook thread which also features the next image on the right, showing that cyclone Soulik is forecast to cause waves as high as 18.54 m or 60.8 ft near Japan on August 20, 2018.

If humidity kept rising, a temperature of 36.4°C at a relative humidity of 91% would result in a wet-bulb temperature of 35°C. No amount of sweating, even in the shade and in front of strong winds or a fan, can cool the body under such conditions, and it would be lethal in a matter of hours in the absence of air conditioning or cold water.

There are further factors that can contribute to make specific areas virtually uninhabitable. The urban heat effect is such a factor. El Niño is another one. Land-only temperature anomalies are higher than anomalies that are averaged for land and oceans. As temperatures keep rising, heat waves can be expected to intensify, while their duration can be extended due to jet stream blocking.

The situation is dire and calls for comprehensive and effective action as described in the Climate Plan.


Below, Paul Beckwith warns that parts of the world 'will soon be rendered uninhabitable'.


Video: Unrelenting Heat, Humidity Will Soon Make Regions UNINHABITABLE

Paul Beckwith: "How hot can it actually get? What is in store for us? When you combine the heat domes sitting over many countries with high humidity, many areas around the planet will soon reach the deadly 35°C (95°F) 100% humidity (wet bulb temperature) or equivalent situation whereby a perfectly healthy person outside, in a well ventilated area, in the shade will die from the heat in 6 hours."

Video: Most Mammals Endure Heat Waves Better Than Humans

"Most people, like the very young, the elderly, and the rest of us won’t last anywhere as long, at even lower temperatures. I discuss the latest peer-reviewed science on how parts of high-risk regions in the North China Plains, Middle East, and South Asia will soon be rendered uninhabitable by combined heat and humidity."

Video: Uninhabitable Regions with Extreme Heat and Humidity


Also watch this video, in which Guy McPherson talks about the way aerosols currently mask the full wrath of global warming.

Video: Edge of Extinction: Rate Matters

Above video is also incorporated in the video below.

Video: McPherson's Paradox

and for the bigger picture, also watch the video below.

Video: Responding to Abrupt Climate Change with Guy R. McPherson


Links

• It could be unbearably hot in many places within a few years time
https://arctic-news.blogspot.com/2016/07/it-could-be-unbearably-hot-in-many-places-within-a-few-years-time.html

• Feedbacks
https://arctic-news.blogspot.com/p/feedbacks.html

• Latent Heat
https://arctic-news.blogspot.com/p/latent-heat.html

• How much warming have humans caused?
https://arctic-news.blogspot.com/2016/05/how-much-warming-have-humans-caused.html

• The Threat
https://arctic-news.blogspot.com/p/threat.html

• Extinction
https://arctic-news.blogspot.com/p/extinction.html

• Climate Plan
https://arctic-news.blogspot.com/p/climateplan.html


Heat Storm

[ click on images to enlarge ]
On April 11, 2018, Arctic sea ice extent was only 13.9 million km². Arctic sea ice extent has been at a record low for the time of year for most of 2018, as illustrated by above image. In 2012, extent went below 3.4 million km². The question is what minimum 2018 extent will be.

Arctic sea ice could disappear altogether in 2018. Have a look at the progressive loss of sea ice volume depicted in the image on the right, from an earlier post. Zero sea ice volume by 2018 is within the margins of the trend line contained in the data going back to 1979.

What drives volume decline is the combination of extent loss and especially thickness loss. Sea ice thickness has declined particularly where the ice once was at its thickest, i.e. north of Greenland and the Canadian Arctic Archipelago.

The combination image below shows the decline of the thicker sea ice, by comparing sea ice thickness on April 15 (run April 14) for the years 2015 through to 2018, showing that sea ice this year is entering the melting season with little or no thick sea ice left north of Greenland and the Canadian Arctic Archipelago to cope with the influx of warmer water.


The image below shows how much Bering Strait sea ice is at a historic low and the associated International Arctic Research Center post describes that this is caused by higher ocean temperatures and frequent storms.


The influx of warm water from the Atlantic Ocean and from the Pacific Ocean is melting the sea ice from below, while sunlight is melting the sea ice from above. Furthermore, warm water from rivers that end in the Arctic Ocean also contribute to melting of the sea ice, and there are numerous feedbacks that can dramatically speed up melting.

Disappearance of the sea ice means that the buffer that until now has consumed huge amounts of heat, will be gone and that heat that previously went into melting the sea ice, will instead warm up the Arctic.

Sea ice can be expected to continue its downward spiral, given the continued rise of the temperature of the sea surface in the North Atlantic Ocean and the North Pacific Ocean, as illustrated by the image below.


The sea surface is not necessarily the place where the water is at its warmest. This is illustrated by the image below, showing subsurface ocean heat in the area most relevant to El Niño/La Niña events.


[ click on images to enlarge ]
We're currently still in a La Niña period in which temperatures are suppressed, as illustrated by the Multivariate El Niño/Southern Oscillation (ENSO) Index image on the right.

As illustrated by the forecast plumes image underneath on the right, it looks like a new El Niño will arrive this summer, which will elevate temperatures from the trend.

This could result in a heat storm as early as summer 2018, in which heat waves could decimate the sea ice, while storms could push the remaining sea ice out of the Arctic Ocean.

This danger is further illustrated by the trend line in the image below, a trend that is contained in NASA LOTI data up to March 2018, adjusted by +0.79°C to better reflect the rise from preindustrial and surface air temperatures, and to better include Arctic temperatures.


[ click on images to enlarge ]
The temperature rise in the Arctic is causing decline of the sea ice extent as well as the extent of the snow cover on land.

The image on the right shows the progressive decline of the spring snow cover on land in the Northern Hemisphere.

A recent study shows that the amount of water melt from the glaciers on Mt. Hunter, Alaska, is now 60 times greater than it was before 1850.

Heat waves combined with strong rainfall due to storms could devastate the snow cover in 2018.

Decline of the snow and ice cover in the Arctic comes with a huge loss in albedo, which means that huge amounts of sunlight that were previously reflected back into space instead get absorbed by the Arctic.

The Buffer has gone, feedback #14 on the Feedbacks page
A rapid rise in temperatures in the Arctic will also accelerate changes to jet stream, which can cause huge amounts of heat from the Atlantic Ocean and the Pacific Ocean to enter the Arctic Ocean, further speeding up its warming and threatening to destabilize methane hydrates in sediments under the Arctic Ocean.

The methane will initially be felt most strongly in the Arctic, further speeding up Arctic warming which is already accelerating due to numerous feedbacks including - as said - the loss of the snow and ice cover in the Arctic, which makes that less sunlight is reflected back into space and instead adds to warming up the Arctic.

All this shouldn't come unexpected. In the video below, Guy McPherson warns that a rapid temperature rise will affect agriculture across the globe, threatening to cause a collapse of industrial civilization, in turn resulting in an abrupt halt of the sulfates that are currently co-emitted as a result of burning fuel, which will further add to a temperature rise that is already threatening to cause people across the globe to perish at massive scale, due to heatstroke, dehydration and famine, if not perish due to nuclear radiation and further toxic effects of war, as people fight over who controls the last habitable places on Earth.


Guy mentions the President of Finland, Sauli Niinistö, who in a press conference on August 28, 2017, warns that: "If we lose the Arctic, we lose the globe". The video below shows an extract of the press conference.


The situation is dire and calls for comprehensive and effective action, as described in the Climate Plan.

Links

• Climate Plan
https://arctic-news.blogspot.com/p/climateplan.html

• Feedbacks in the Arctic
https://arctic-news.blogspot.com/p/feedbacks.html

• How much warmer is it now?
https://arctic-news.blogspot.com/2018/04/how-much-warmer-is-it-now.html

• Extinction
https://arctic-news.blogspot.com/p/extinction.html

• Ten Dangers of Global Warming
https://arctic-news.blogspot.com/p/ten-dangers-of-global-warming.html

• Methane Erupting From Arctic Ocean Seafloor
https://arctic-news.blogspot.com/2017/03/methane-erupting-from-arctic-ocean-seafloor.html

• Warning of mass extinction of species, including humans, within one decade
https://arctic-news.blogspot.com/2017/02/warning-of-mass-extinction-of-species-including-humans-within-one-decade.html

• In the coastal communities near the Bering Strait, a winter unlike the rest
https://www.climate.gov/news-features/features/coastal-communities-near-bering-strait-winter-unlike-rest

• A 400‐Year Ice Core Melt Layer Record of Summertime Warming in the Alaska Range
https://agupubs.onlinelibrary.wiley.com/doi/abs/10.1002/2017JD027539

• Warning Signs
https://arctic-news.blogspot.com/2018/03/warning-signs.html


2017 was hottest year on record

The year 2017 was the hottest year on record, as the image below illustrates.


When determining which year was the hottest year, care should be taken to avoid bias due to temporary conditions such as the El Niño that was present in 2016 and the La Niña we're now experiencing now. Above image uses NASA land+ocean January 2012-December 2017 anomalies from 1951-1980, adjusted by 0.59°C to cater for the rise from preindustrial to 1951-1980, to calculate a linear trend that goes some way to smooth out variability due to El Niño/La Niña events. The trend shows that 2017 was significantly warmer than 2016.

The trend also shows that 1.5°C above preindustrial was crossed back in 2016. This 1.5°C (or 2.7°F) was set at the Paris Agreement as a guardrail that was not to be crossed. The trend further shows that we've meanwhile crossed 1.6°C above preindustrial and we look set to cross the 2°C guardrail within years.


Global warming has crossed 1.5°C / 2.7°F above preindustrial and looks set to cross 2°C / 3.6°F soon. Due to accelerating warming in the Arctic, that could happen within one or two years time, i.e. much faster than the trendlines below may suggest.


Indeed, warming in the Arctic is taking place much faster than elsewhere, and the difference is accelerating. There's a huge danger that accelerating warming in the Arctic will speed up feedbacks such as:
• huge amounts of methane getting released from the seafloor of the Arctic Ocean;
• melting of sea ice and permafrost causing more sunlight to get absorbed in the Arctic, as less sunlight gets reflected back into space;
• changes to jet streams causing more extreme weather, in turn resulting in more emissions, such as due to wildfires;
• and more.

In conclusion, feedbacks could speed up global warming by much more than what may be suggested by above trends that look only at surface temperature of the atmosphere and that are based on previous data when such feedbacks had yet to become manifest.

Add up the impact of all warming elements and, as an earlier analysis shows, the rise in mean global temperatures from preindustrial could be more than 10°C in a matter of years, as illustrated by the image below, which shows a much steeper rise.


Particularly devastating feedbacks could result from changes regarding heat and carbon dioxide taken up by oceans. Oceans now take up 93.4% of global warming, as illustrated by the image below.


As said, when looking at surface temperatures of the atmosphere, there will be bias due to El Niño/La Niña events. One way to smooth out such bias is by calculating trendlines over many years. Another way to compensate for such bias is to also look at ocean heat. In terms of ocean heat, the year 2017 stands at the top, as the left panel of above image illustrates. In 2016, El Niño caused relatively more heat to be present in the atmosphere and less in oceans, whereas the opposite occurred in 2017, contributing to the fact that in 2017 a record amount of ocean heat was recorded. Occurrence of El Niño/La Niña events over the years is visualized by the image below.


One danger is that, in future, there will be more impact by El Niño events and less by La Niña events. A recent study concludes that as temperatures rise due to emissions by people, the frequency, magnitude and duration of strong El Niño events will increase.

In addition to higher temperature peaks due to El Niño events, more heat could remain in the atmosphere as the rise in temperature in general causes greater ocean stratification, making that less heat gets absorbed by oceans, as discussed in several earlier posts. The image below depicts this feedback and further feedbacks mentioned above. Feedbacks are described in more detail at the feedbacks page.


The situation is further illustrated by the danger assessment below.

[ Danger Assessment, from earlier post ]
Meanwhile, the Global Carbon Project projects a growth of 2% for the 2017 global carbon dioxide emissions from fossil fuels and industry (including cement production), compared to 2016 levels, as illustrated by image below.  

The situation is dire and calls for comprehensive and effective action as described in the Climate Plan.


Links

• Climate Plan
https://arctic-news.blogspot.com/p/climateplan.html

• Warming is accelerating
https://arctic-news.blogspot.com/2017/11/warming-is-accelerating.html

• The Arctic is changing the Jet Stream - Why This Is Important
https://arctic-news.blogspot.com/2017/10/the-arctic-is-changing-the-jet-stream-why-this-is-important.html

• 10°C or 18°F warmer by 2021?
https://arctic-news.blogspot.com/2017/04/10c-or-18f-warmer-by-2021.html

• Abrupt Warming - How Much And How Fast?
https://arctic-news.blogspot.com/2017/05/abrupt-warming-how-much-and-how-fast.html

• Feedbacks
https://arctic-news.blogspot.com/p/feedbacks.html

• Extinction
https://arctic-news.blogspot.com/p/extinction.html

• Methane Erupting From Arctic Ocean Seafloor
https://arctic-news.blogspot.com/2017/03/methane-erupting-from-arctic-ocean-seafloor.html

• Warning of mass extinction of species, including humans, within one decade
https://arctic-news.blogspot.com/2017/02/warning-of-mass-extinction-of-species-including-humans-within-one-decade.html


Warming is accelerating


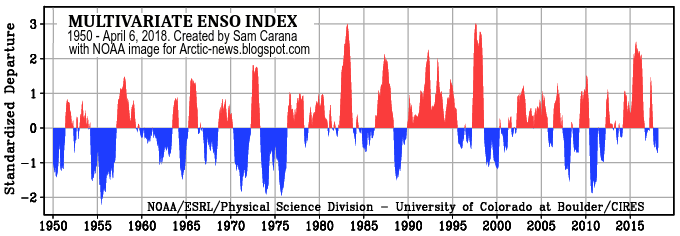
Warming is accelerating. For some time, it has been warmer than the 1.5°C guardrail that the Paris Agreement promised should not be crossed. This conclusion follows from above analysis of NASA land+ocean data 1880-October 2017, adjusted by 0.59°C to cater for the rise from preindustrial and with a trend added that also indicates that the global temperature look set to cross the 2°C guardrail soon, with 2021 falling within the margins of the trend line.
[ click on images to enlarge ]

The trend line shows a strong and ominous direction upward. Nonetheless, the situation could be even more dire than this trend indicates, since some warming elements are not fully incorporated in these data.

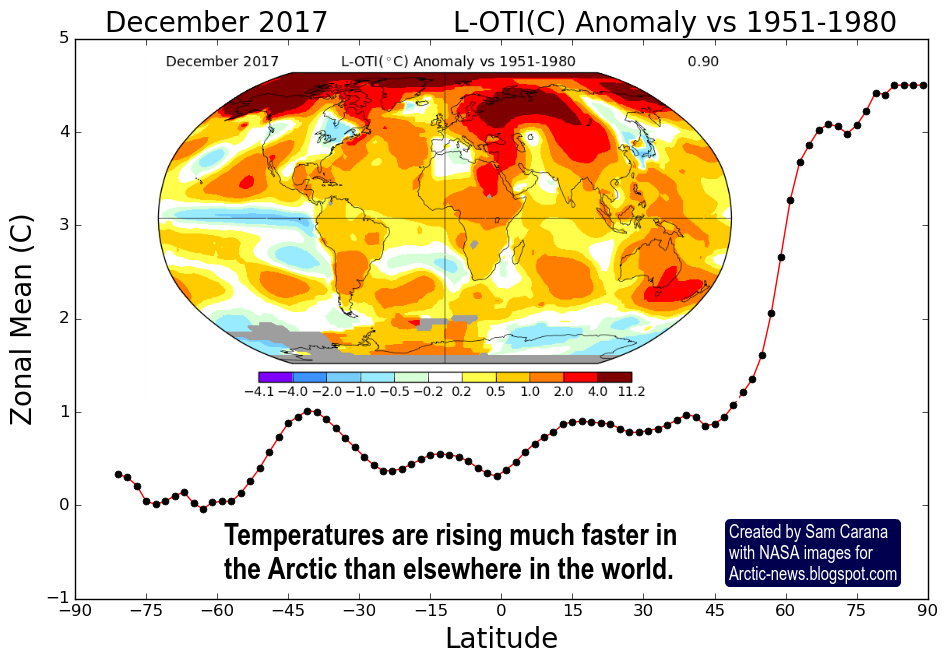
As an example, the NASA data look at the temperature at the surface of the oceans, which has increased strongly, as also illustrated by the image on the right.

Much warming has also occurred below the sea surface, while there has been some cooling of the sea surface. Moreover, ocean heat has also increased strongly over the years, as the image below illustrates, and looks set to increase further.

After all, what happens to oceans is important, as 93.4% of global warming currently goes into oceans.


The fact that much warming is taking place below the sea surface could make that it gets overlooked. If much of this warming were to get transferred from the Arctic Ocean to the atmosphere over the next few years, then the temperature rise over the next few years could take an even sharper turn upward.

The threat that warming below the sea surface is overlooked is highlighted by the image below, which shows huge warming of Arctic waters at selected locations near Svalbard.


Above image focuses on temperatures at selected locations near Svalbard (see map below). In 1981-2011, temperatures were gradually falling by more than one degree Celsius over the period of measurement, i.e. from October 1 to November 23 (blue line), a fall that is in line with the change in seasons. Over this period in 2017, temperatures were 13.19°C or 23.77°F higher than in 1981-2011, while the temperature didn't seem to be falling (red line).


How could these waters get a stunning 13.19°C warmer than two decades ago?

Global warming did hit the North Atlantic hard, particularly along the track of the Gulf Stream all the way to the Arctic Ocean. This has translated into stronger winds along the track of the Gulf Stream, which are making that ever larger amounts of warm water are getting pushed from the North Atlantic to the Arctic Ocean.

A temperature rise underneath the sea surface can be overlooked when merely monitoring the average surface temperature of the Arctic Ocean, especially when stronger winds have caused more evaporation, cooling down the water at the surface.

[ 100% relative humidity (left) as jet stream moves over Arctic Ocean (right) ]
Stronger winds, higher temperatures and the presence of more open water in the Arctic have all contributed to stronger rainfall in the Arctic. It looks like the rain did cause a freshwater lid to form at the surface of the Arctic Ocean, acting as an insulator and preventing transfer of ocean heat to the atmosphere. This also contributed to a colder atmosphere over the Arctic Ocean, i.e. colder than it would otherwise have been. At the same time, since less heat could escape from the Arctic Ocean to the atmosphere, this freshwater lid has resulted in warmer water, as is evident from the huge anomalies at the locations near Svalbard. The forecast below that Arctic will be 7.2°C or 12.96°F warmer than in 1979-2000 on December 3, 2017, illustrates just how warm the Arctic Ocean currently is.


This freshwater lid has also made it easier for sea ice to form at the surface, as ice will form in freshwater as warm as just below 0°C (or 32°F), compared to salty seawater that must cool down to -2°C (or 28.4°F) before freezing. The seawater underneath the sea ice is warm enough to melt the ice from below, but the layer of freshwater at the surface acts as an insulator.

There would have been less sea ice, had it not been for the rain resulting in this freshwater lid. Much of the freshwater lid did turn into sea ice in September 2017, as air temperatures came down below 0°Cs, and this sea ice similarly acted as an insulator, preventing transfer of heat from the Arctic Ocean to the atmosphere. Importantly, while much of the additional freshwater at the surface did turn into sea ice in 2017, this is only a temporary phenomenon, as no ice will form once the surface of the water will stay above 0°C, which looks imminent as temperatures keep rising.


[ Cyclone carrying particulates into the Arctic Ocean ]
Further sea ice loss means that less sunlight will get reflected back into space and will instead get absorbed by the Arctic, further accelerating warming in the arctic.

Additionally, more heat is radiated from sea ice into space than from open water (feedback #23).

Stronger cyclones can also bring more particulates into the Arctic Ocean, speeding up the demise of sea ice by darkening it when settling on ice, as illustrated by the image on the right.

In conclusion, while the formation of the freshwater lid at the surface of the Arctic Ocean has been holding back the collapse of the sea ice, the delay of the collapse can only be a temporary one as temperatures keep rising. The Arctic Ocean is warming at accelerating speed and collapse of the sea ice looks imminent.

[ click on image to enlarge ]

Above images confirm the loss of the thicker sea ice over the past few years, while zero Arctic sea ice is within the margins of the trend line of the image on the right.

Less sea ice will on the one hand make that more heat can escape from the Arctic Ocean to the atmosphere, but on the other hand the albedo loss and the additional water vapor will at the same time cause the Arctic Ocean to absorb more heat, with the likely net effect being greater warming of the Arctic Ocean.

Another point to consider is latent heat, as discussed in earlier posts. The danger is illustrated by the image below, showing that heat threatens to destabilize methane hydrates at the seafloor of the Arctic Ocean. As the temperature of the Arctic Ocean keeps rising, more heat threatens to reach sediments that have until now remained frozen. Melting of the ice in these sediments then threatens to unleash huge eruptions of seafloor methane that has until now been kept locked up by the permafrost.

The Buffer has gone, feedback #14 on the Feedbacks page
Additionally, melting of permafrost on land can cause rapid decomposition of soils, resulting in releases of huge amounts of greenhouse gases, further accelerating warming in the Arctic, which in turn will result in more greenhouse gases (CO2, CH4, N2O, water vapor) entering the Arctic atmosphere, more albedo changes, etc., in a vicious self-reinforcing cycle of runaway warming.


Levels of CO2, CH4 an N2O have been rising rapidly since 1750, as above image shows. Methane levels have risen 257% since 1750.

Did the rise in methane emissions slow down from 1999 to 2006?

One explanation for the apparent slowdown is that, as temperatures kept rising, water vapor in the atmosphere increased accordingly (7% more water vapor for every 1°C warming), resulting in more hydroxyl that broke down more methane in the atmosphere since 1990. So, while the rise in methane levels appeared to slow down, methane emissions were actually continuing to increase, but as an increasingly large part of methane was decomposed by hydroxyl, this rise in methane was overlooked. In 2007, Arctic sea ice reached a record low, triggering more methane eruptions from the seafloor of the Arctic Ocean. While hydroxyl kept increasing, seafloor methane kept increasing faster, making that methane emissions increasingly started to overwhelm hydroxyl, resulting in a stronger rise in overall methane levels. In 2013, I estimated methane emissions at 771 Tg/y, whereas the IPCC's estimate was 678 Tg/y. The post estimated methane from hydrates and permafrost at 13% of total methane emissions, whereas the IPCC's estimate was a mere 1% of total methane emissions. - Sam Carana, Dec. 2017.


[ click on images to enlarge ]
The presence of methane is felt particularly strongly over the Arctic Ocean. Above images show high methane levels over the Arctic Ocean on December 2, 2017, when methane reached a peak level of 2771 ppb and on December 13 and 14, 2017, when peak levels as high as 2713 ppb were reached.

Methane levels have been rising strongly since 2000 and this rise looks set to continue, as illustrated by the image on the right.

There is also a danger that, as temperatures keep rising, the course of the ocean current near Svalbard could change, making that more heat will reach the East Siberian Arctic Shelf (ESAS), thus further warming up sediments there, resulting in huge amounts of methane erupting from the seafloor.

Add up the impact of all warming elements and, as an earlier analysis shows, the rise in mean global temperatures from preindustrial could be more than 10°C in a matter of years, as illustrated by the images below.


A 2°C rise in temperature alone is devastating, especially when considering that temperature peaks in history look to have been less high than previously thought, as concluded by a recent study in ocean paleotemperature. Therefore, a 10°C rise may well result in the warmest temperatures experienced on Earth. Moreover, the speed at which this rise could occur leaves little or no time for plants and animals to adapt, in contrast to historical climate swings that typically took many years to eventuate.


The situation is dire and calls for comprehensive and effective action, as described in the Climate Plan.


Links

• Climate Plan
https://arctic-news.blogspot.com/p/climateplan.html

• 10°C or 18°F warmer by 2021?
https://arctic-news.blogspot.com/2017/04/10c-or-18f-warmer-by-2021.html

• Abrupt Warming - How Much And How Fast?
https://arctic-news.blogspot.com/2017/05/abrupt-warming-how-much-and-how-fast.html

• Accelerating growth in CO₂ levels in the atmosphere
https://arctic-news.blogspot.com/2017/02/accelerating-growth-in-co2-levels-in-the-atmosphere.html

• High methane levels over the Arctic Ocean on January 14, 2014
https://arctic-news.blogspot.com/2014/01/high-methane-levels-over-the-arctic-ocean-on-january-14-2014.html

• Feedbacks
https://arctic-news.blogspot.com/p/feedbacks.html

• Extinction
https://arctic-news.blogspot.com/p/extinction.html

• Methane Erupting From Arctic Ocean Seafloor
https://arctic-news.blogspot.com/2017/03/methane-erupting-from-arctic-ocean-seafloor.html

• Warning of mass extinction of species, including humans, within one decade
https://arctic-news.blogspot.com/2017/02/warning-of-mass-extinction-of-species-including-humans-within-one-decade.html


Designed with by Way2themes | Distributed by Blogspot Themes