In the North Pacific, the flow of warmer water is clearly visible (see images right, green circle left).
 In the North Atlantic, huge amounts of heat are moving into the Arctic Ocean (green circle right).
At some spots, heat that is traveling underneath the sea surface comes to the surface (green circle at the top).
Most warming caused by people's emissions goes into oceans, especially into the top layer of oceans.
 Furthermore, warmer air and warmer sea surfaces can cause winds to grow dramatically stronger. As the Arctic is warming much faster than the rest of the world, the narrowing difference between the temperatures at the North Pole and the Equator is decreasing the speed at which winds circumnavigate Earth; at the same time, the amount of heat that is moving north can grow dramatically, both due to winds and sea currents, and cyclones can further accelerate this.
The danger is that an influx of warm salty water will reach the seafloor and trigger methane eruptions.
 The situation is especially critical in many parts of the Arctic Ocean where the water is very shallow. Some 75% of the East Siberian Arctic Shelf (ESAS) is shallower than 50 m (see maps on the right).
 |
| [ warm water from the Atlantic Ocean is increasingly invading the Arctic Ocean ] |

The danger here is huge, for numerous reasons, incl.:
• shallow waters can warm up very rapidly in case of an influx of warm water;
• these shallow seas are now covered by ice, so the heat cannot escape to the atmosphere;
• sea ice is very thin, so the sea ice won't act as a buffer to absorb the heat;
• methane rising through shallow waters will pass through the water column and enter the atmosphere more quickly;
• in shallow waters, large abrupt releases will more quickly deplete the oxygen in the water, making it harder for microbes to break down the methane;
• hydroxyl levels over the Arctic are very low, which means that it takes much longer for methane over the Arctic to get broken down.
The four videos below provide a good introduction into the various issues and illustrate how dangerous the situation is in the Arctic.
Each video is part of a talk between Dave Borlace and Peter Wadhams.
Part 1 discusses albedo change in the Arctic and associated changes such as jet stream changes.
Part 2 discusses the threat of huge methane releases in the Arctic.
Part 3 discusses the thermohaline circulation and methods that could improve the situation such as carbon removal and Ocean Mechanical thermal Energy Conversion (OMTEC).
Part 4 discusses sea level rise and fires.
The situation is dire and calls for comprehensive and effective action, as described at the Climate Plan, i.e. multiple lines of action implemented in parallel and locally where possible.
Links
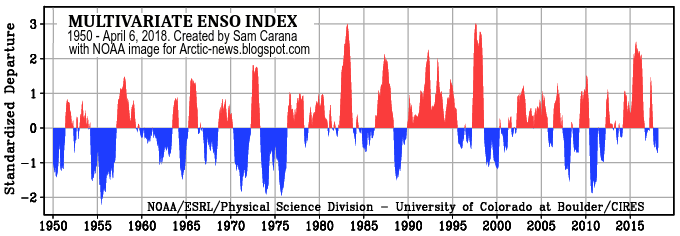
• As El Niño sets in, will global biodiversity collapse in 2019?
https://arctic-news.blogspot.com/2018/11/as-el-nino-sets-in-will-global-biodiversity-collapse-in-2019.html
• Doomsday by 2021?
https://arctic-news.blogspot.com/2018/11/doomsday-by-2021.html
• Climate Plan
https://arctic-news.blogspot.com/p/climateplan.html
• Feedbacks
https://arctic-news.blogspot.com/p/feedbacks.html
• Extinction
https://arctic-news.blogspot.com/p/extinction.html
• Seismic Events
https://arctic-news.blogspot.com/p/seismic-events.html
• Can we weather the Danger Zone?
https://arctic-news.blogspot.com/2018/07/can-we-weather-the-danger-zone.html
• How much warmer is it now?
https://arctic-news.blogspot.com/2018/04/how-much-warmer-is-it-now.html
• What Does Runaway Warming Look Like?
https://arctic-news.blogspot.com/2018/10/what-does-runaway-warming-look-like.html
• Peaks Matter
https://arctic-news.blogspot.com/2018/08/peaks-matter.html
• Warning of mass extinction of species, including humans, within one decade
https://arctic-news.blogspot.com/2017/02/warning-of-mass-extinction-of-species-including-humans-within-one-decade.html