Showing posts with label thickness. Show all posts

Heat Storm

[ click on images to enlarge ]
On April 11, 2018, Arctic sea ice extent was only 13.9 million km². Arctic sea ice extent has been at a record low for the time of year for most of 2018, as illustrated by above image. In 2012, extent went below 3.4 million km². The question is what minimum 2018 extent will be.

Arctic sea ice could disappear altogether in 2018. Have a look at the progressive loss of sea ice volume depicted in the image on the right, from an earlier post. Zero sea ice volume by 2018 is within the margins of the trend line contained in the data going back to 1979.

What drives volume decline is the combination of extent loss and especially thickness loss. Sea ice thickness has declined particularly where the ice once was at its thickest, i.e. north of Greenland and the Canadian Arctic Archipelago.

The combination image below shows the decline of the thicker sea ice, by comparing sea ice thickness on April 15 (run April 14) for the years 2015 through to 2018, showing that sea ice this year is entering the melting season with little or no thick sea ice left north of Greenland and the Canadian Arctic Archipelago to cope with the influx of warmer water.


The image below shows how much Bering Strait sea ice is at a historic low and the associated International Arctic Research Center post describes that this is caused by higher ocean temperatures and frequent storms.


The influx of warm water from the Atlantic Ocean and from the Pacific Ocean is melting the sea ice from below, while sunlight is melting the sea ice from above. Furthermore, warm water from rivers that end in the Arctic Ocean also contribute to melting of the sea ice, and there are numerous feedbacks that can dramatically speed up melting.

Disappearance of the sea ice means that the buffer that until now has consumed huge amounts of heat, will be gone and that heat that previously went into melting the sea ice, will instead warm up the Arctic.

Sea ice can be expected to continue its downward spiral, given the continued rise of the temperature of the sea surface in the North Atlantic Ocean and the North Pacific Ocean, as illustrated by the image below.


The sea surface is not necessarily the place where the water is at its warmest. This is illustrated by the image below, showing subsurface ocean heat in the area most relevant to El Niño/La Niña events.


[ click on images to enlarge ]
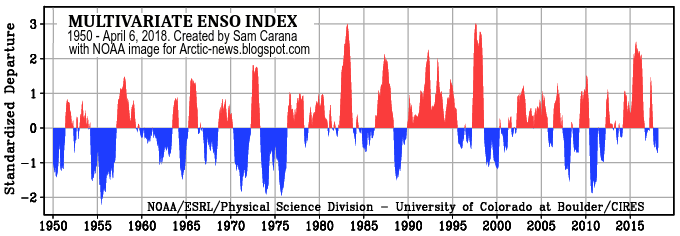
We're currently still in a La Niña period in which temperatures are suppressed, as illustrated by the Multivariate El Niño/Southern Oscillation (ENSO) Index image on the right.

As illustrated by the forecast plumes image underneath on the right, it looks like a new El Niño will arrive this summer, which will elevate temperatures from the trend.

This could result in a heat storm as early as summer 2018, in which heat waves could decimate the sea ice, while storms could push the remaining sea ice out of the Arctic Ocean.

This danger is further illustrated by the trend line in the image below, a trend that is contained in NASA LOTI data up to March 2018, adjusted by +0.79°C to better reflect the rise from preindustrial and surface air temperatures, and to better include Arctic temperatures.


[ click on images to enlarge ]
The temperature rise in the Arctic is causing decline of the sea ice extent as well as the extent of the snow cover on land.

The image on the right shows the progressive decline of the spring snow cover on land in the Northern Hemisphere.

A recent study shows that the amount of water melt from the glaciers on Mt. Hunter, Alaska, is now 60 times greater than it was before 1850.

Heat waves combined with strong rainfall due to storms could devastate the snow cover in 2018.

Decline of the snow and ice cover in the Arctic comes with a huge loss in albedo, which means that huge amounts of sunlight that were previously reflected back into space instead get absorbed by the Arctic.

The Buffer has gone, feedback #14 on the Feedbacks page
A rapid rise in temperatures in the Arctic will also accelerate changes to jet stream, which can cause huge amounts of heat from the Atlantic Ocean and the Pacific Ocean to enter the Arctic Ocean, further speeding up its warming and threatening to destabilize methane hydrates in sediments under the Arctic Ocean.

The methane will initially be felt most strongly in the Arctic, further speeding up Arctic warming which is already accelerating due to numerous feedbacks including - as said - the loss of the snow and ice cover in the Arctic, which makes that less sunlight is reflected back into space and instead adds to warming up the Arctic.

All this shouldn't come unexpected. In the video below, Guy McPherson warns that a rapid temperature rise will affect agriculture across the globe, threatening to cause a collapse of industrial civilization, in turn resulting in an abrupt halt of the sulfates that are currently co-emitted as a result of burning fuel, which will further add to a temperature rise that is already threatening to cause people across the globe to perish at massive scale, due to heatstroke, dehydration and famine, if not perish due to nuclear radiation and further toxic effects of war, as people fight over who controls the last habitable places on Earth.


Guy mentions the President of Finland, Sauli Niinistö, who in a press conference on August 28, 2017, warns that: "If we lose the Arctic, we lose the globe". The video below shows an extract of the press conference.


The situation is dire and calls for comprehensive and effective action, as described in the Climate Plan.

Links

• Climate Plan
https://arctic-news.blogspot.com/p/climateplan.html

• Feedbacks in the Arctic
https://arctic-news.blogspot.com/p/feedbacks.html

• How much warmer is it now?
https://arctic-news.blogspot.com/2018/04/how-much-warmer-is-it-now.html

• Extinction
https://arctic-news.blogspot.com/p/extinction.html

• Ten Dangers of Global Warming
https://arctic-news.blogspot.com/p/ten-dangers-of-global-warming.html

• Methane Erupting From Arctic Ocean Seafloor
https://arctic-news.blogspot.com/2017/03/methane-erupting-from-arctic-ocean-seafloor.html

• Warning of mass extinction of species, including humans, within one decade
https://arctic-news.blogspot.com/2017/02/warning-of-mass-extinction-of-species-including-humans-within-one-decade.html

• In the coastal communities near the Bering Strait, a winter unlike the rest
https://www.climate.gov/news-features/features/coastal-communities-near-bering-strait-winter-unlike-rest

• A 400‐Year Ice Core Melt Layer Record of Summertime Warming in the Alaska Range
https://agupubs.onlinelibrary.wiley.com/doi/abs/10.1002/2017JD027539

• Warning Signs
https://arctic-news.blogspot.com/2018/03/warning-signs.html


Arctic Sea Ice Break Up August 2017

Sun at 8:00 am, captured by Jim Reeve on August 7, 2017 near Sechelt AirPort, B.C., Canada
Arctic sea ice is under attack from all sides.  At this time of year, the sun doesn't set at the higher latitudes.

As the image below shows, it was as hot as 94°F or 34.5°C in North Canada on August 13, 2017 (at the green circle, at 1000 hPa, at 00:00 UTC). Temperatures at surface level were as high as 33.1°C or 91.5°F at that location, where wind was coming from the south and blowing toward the north at a speed of 28 km/h or 17 mph at that time.


Above image shows cyclonic winds over the Arctic Ocean pulling warm air from North Canada over the Arctic Ocean, while pushing cold air out. Winds and rain have been battering the sea ice for some time now, as discussed in an earlier post.

Fires are becoming more devastating, as discussed in an earlier post. The August 2, 2017, satellite image below shows smoke from fires in British Columbia blanketing Vancouver and Seattle. Carbon dioxide (CO₂) levels were as high as 527 ppm, carbon monoxide (CO) levels as high as 12.59 ppm and sulfur dioxide (SO₂) levels as high as 490.77 µg/m³, as these images show.  


The combination image below shows forecasts for August 8, 2017, 13:30 UTC. CO levels were forecast to be as high as 29.05 ppm, CO₂ levels as high as 625 ppm and SO₂ levels as high as 1089.65 µg/m³ (each time at the green circle). Also note the emissions from forest fires in Siberia.


Actual levels were even higher at that spot on August 11, 2017, when CO was as high as 30.97 ppm, CO₂ was as high as 633 ppm and SO₂ was as high as 1150.19 µg/m³, as illustrated by the image below.

[ click on images to enlarge ]
The image below, by Harold Hensel, shows smoke over British Columbia, Washington, and Montana on August 9, 2017.


Winds can carry smoke from forest fires over long distances, all the way to the Arctic sea ice, where the soot can settle and darken the ice, thus speeding up its decline. The image below, also by Harold Hensel, shows smoke from fires in Russia entering the Arctic Ocean near the Laptev Sea on August 9, 2017. 


The image below shows the situation on August 14, 2017.


Canadian wildfires caused PM10 to reach levels as high as 11,599 μg/m³ on August 16, 2017, at the location marked by the green circle. The image below shows PM10 getting blown over the Arctic Ocean.


The thickest sea ice in the Arctic Ocean is located close to the north of Greenland and the Canadian Archipelago. This ice is now breaking up, due to high temperatures and strong cyclonic winds that cause warm rain, high waves and strong sea currents.

Watch the thickest sea ice break up on the animation below. This is a 17 MB file, so it may take some time to fully load. Click here if you do not see the file appear below.

The animation below shows the thickest sea ice breaking up between July 14, 2017, and August 13, 2017. 

[ click on image to enlarge ]

The situation is dire and calls for comprehensive and effective action, as described at the Climate Plan.


Less sea ice, warmer Arctic Ocean

On November 2, 2016, Arctic sea ice extent was at a record low for the time of the year, i.e. only 7.151 million km².
The currently very low sea ice extent is further dragging down the average annual sea ice extent, which is also at a record low, as illustrated by the image below, from the blog by Torstein Viðdalr.


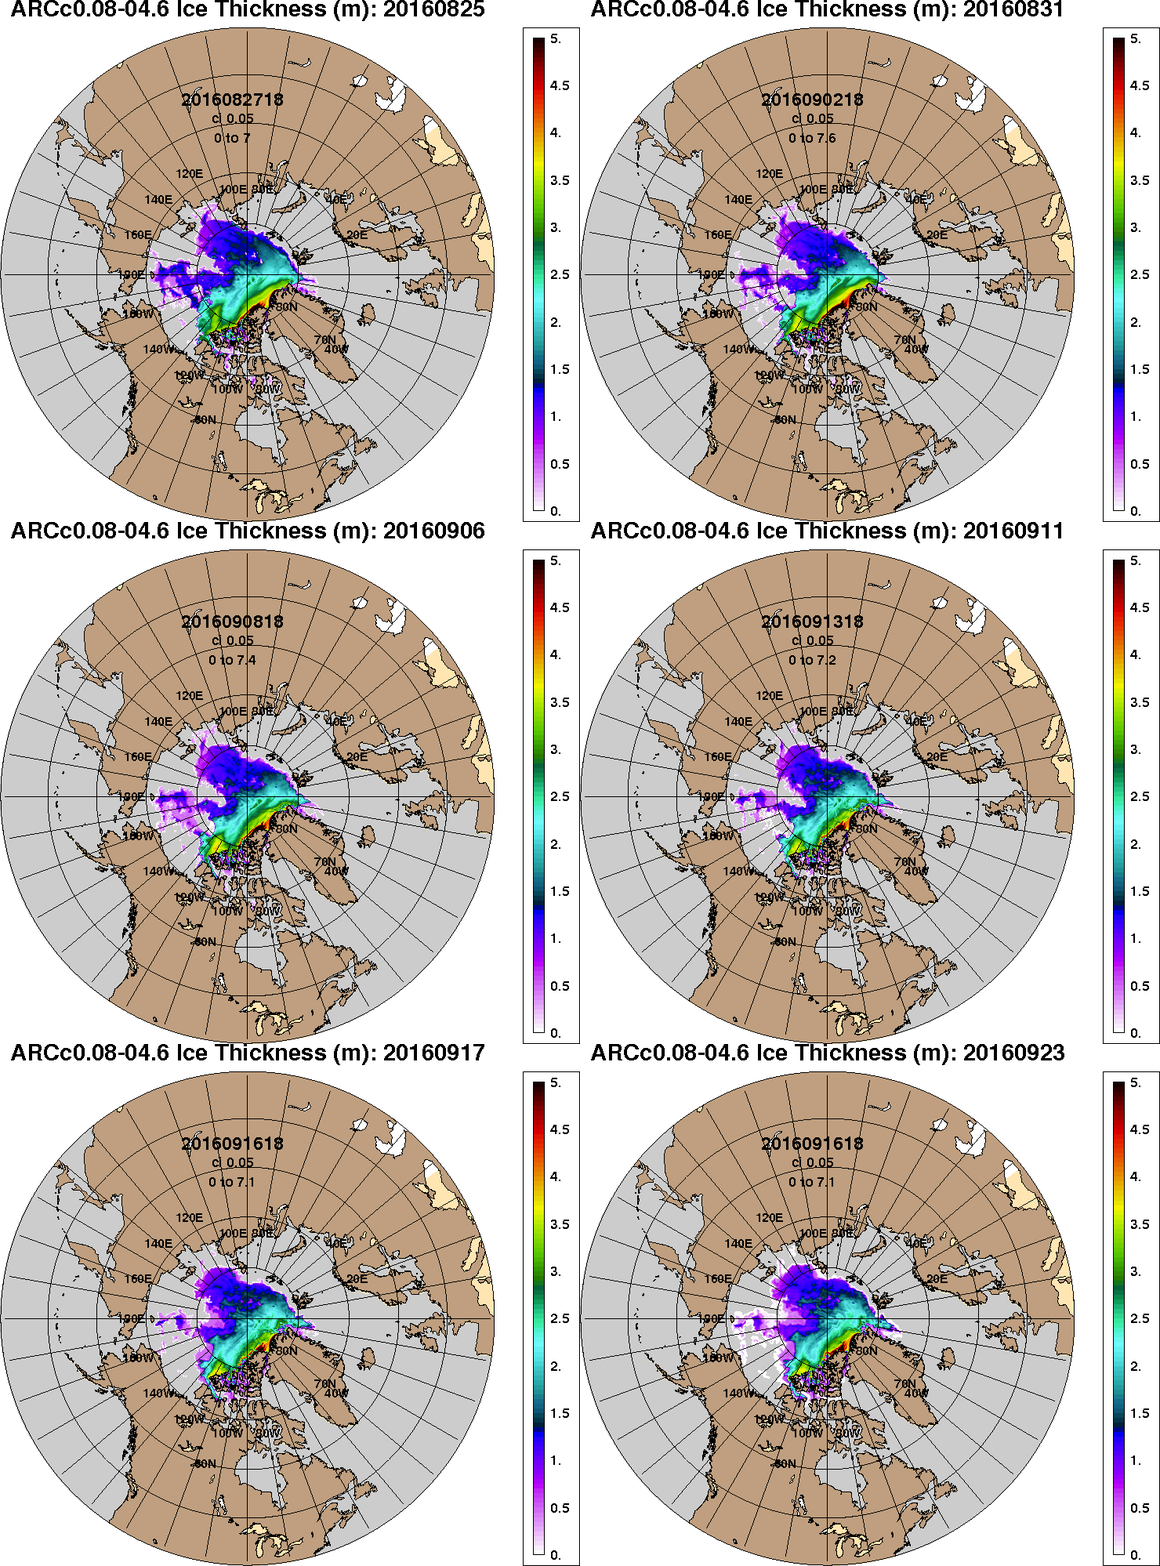
Not only is Arctic sea ice extent very low, the sea ice is getting thinner and thinner, as illustrated by the image below, by Wipneus, showing the dramatic recent decline of Arctic sea ice thickness.
As the Naval Research Lab 30-day animation below shows, Arctic sea ice isn't getting much thicker, despite the change of seasons.

Naval Research Lab 30-day animation (new model) up to Nov 1, 2016, with forecast up to Nov 9, 2016
In the two videos below, Paul Beckwith further explains the situation.


Paul Beckwith: "Arctic sea ice regrowth is eff'd this year, in fact is truly horrible. As the ice extent, defined as regions with at least 15% ice, tries to expand via sea water freezing, it is melted out by extremely high sea surface temperatures. Then the cooled surface water mixes via wave action with warmer water down to as much as 200 meters and the warm mixtures at the surface continue the process of sea ice melting. Without strong ice regrowth, we will reach the state we are heading to. Namely, zero sea ice. We must break this vicious cycle, by declaring a global climate emergency, and implementing the three-legged-stool solution set."


As global warming raises the temperature of the sea surface and the atmosphere over the sea surface, ever stronger winds develop, in turn resulting in stronger waves and higher amounts of water in clouds.

The image below shows forecasts for November 9, 2016, of waves as high as 13.76 m (green circle, left panel) and of total amounts of water (from surface to space) as much as 1.38 kg/m² (green circle right panel, near Novaya Zemlya).

[ click on images to enlarge ]
High waves make it hard for sea ice to form, while greater evaporation from warmer oceans adds more water vapor to the atmosphere. More water vapor in the atmosphere results more precipitation. Rain can devastate the sea ice, as discussed in an earlier post. Furthermore, snow can inhibit formation of thicker is, as David Barber explains. Also, being a potent greenhouse gas, water vapor will further accelerate warming of the Arctic.

The dire state of the sea ice indicates that the water of the Arctic Ocean is getting warmer and warmer.


On October 31, 2016, the Arctic Ocean was as warm as 17°C or 62.7°F (green circle near Svalbard), or 13.9°C or 25°F warmer than 1981-2011. This indicates how much warmer the water is beneath the surface, as it arrives in the Arctic Ocean from the Atlantic Ocean.

Below is an update of the situation on methane. Contained in existing data is a trend indicating that methane levels could increase by a third by 2030 and could almost double by 2040.


Why is methane so important? On a 10-year timescale, methane causes more warming than carbon dioxide. Unlike carbon dioxide, methane's Global Warming Potential rises as more of it is released. Methane's lifetime can be extended to decades, in particular due to depletion of hydroxyl in the atmosphere.


Ominously, the image below shows that on November 9, 2016, methane levels were very high over the Laptev Sea (solid magenta color north of Siberia). 

The image below shows that methane levels on November 9, 2016, were as high as 2633 parts per billion (at a slightly higher altitude corresponding to a pressure of 469 mb). 
Temperatures over the Arctic Ocean are forecast to remain high, reflecting the very high temperature of the water.


The danger is that, as global warming continues and as the Arctic snow and ice cover keeps shrinking, warming of the Arctic Ocean will speed up and destabilize methane hydrates contained in sediments at its seafloor, triggering huge methane eruptions that will further accelerate warming. This could contribute to make global temperature rise by as much as 10°C or 18°F over the coming decade.

The situation is dire and calls for comprehensive and effective action, as described in the Climate Plan.


Blue Ocean Event September 2017?

Will there be a Blue Ocean Event in September 2017, during which the Arctic Ocean will be virtually ice-free? What would be the significance of such an event?

The Arctic Ocean is about to become virtually ice-free, perhaps as early as next year. At first, this Blue Ocean Event may last for one or more days in September 2017. Over the years, the ice-free period will grow longer and longer, if no action is taken.

Projections of an ice-free Arctic Ocean have been made for years. What makes the prospect of a Blue Ocean Event so dire?

Disappearance of the sea ice means that a huge amount of sunlight that was previously reflected back into space, is instead getting absorbed by the Arctic. The reason for this is that sea ice is more reflective than the water of the Arctic Ocean. The situation on land in the Arctic is similar, i.e. the snow and ice cover on land is more reflective than the darker soil and rocks that get uncovered as the snow and ice disappears. So, extra heat gets added and this is accelerating warming in the Arctic. On land, extra heat will also warm up water of rivers, and a lot of this heat will end up in the Arctic Ocean.

Another feedback is water vapor, as highlighted in the diagram below.


A warmer atmosphere carries more water vapor. Since water vapor is a potent greenhouse gas, this further accelerates warming over the Arctic.


As above image shows, temperatures have been more than 2.5°C warmer than 1981-2010 over most of the Arctic Ocean over the past 365 days (up to October 7, 2016). Accelerated Arctic warming has been taking place for a long time. So, what is it that makes a Blue Ocean Event, a virtually ice-free Arctic Ocean, such a big thing?

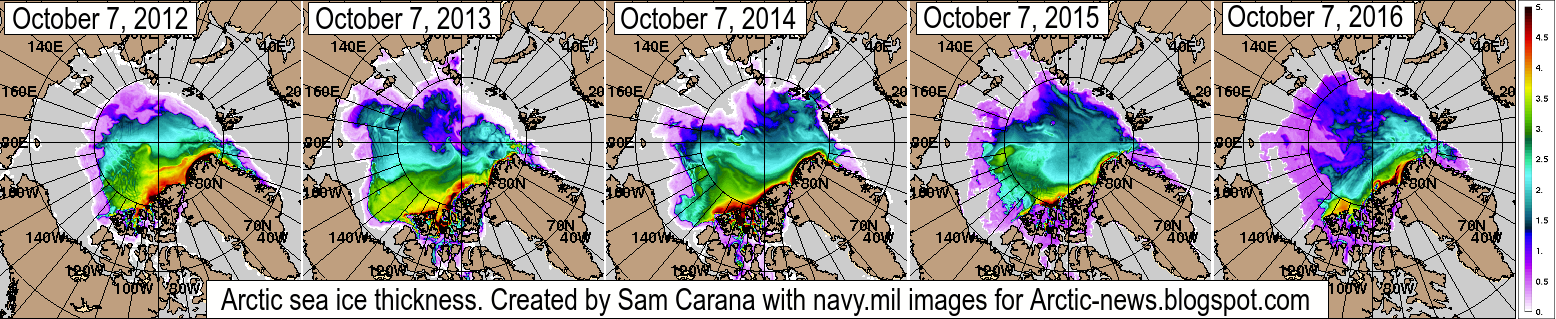
It is a huge event, because once the sea ice is gone, warming of the Arctic Ocean is likely to speed up even more dramatically. Why? Because having no more sea ice means that the buffer is gone. In the past, thick sea ice extended meters below the sea surface, in many parts of the Arctic Ocean. Melting of this ice into water did consume massive amounts of ocean heat. As such, thick sea ice acted as a buffer. Over the years, Arctic sea ice has become thinner and thinner, as illustrated by the image below.

[ click on image to enlarge ]
Over the past few years, trends have been pointing at zero thickness soon, i.e. in a matter of years. Added below is a trend produced by Arctische Pinguin, pointing at zero volume sea ice in the year 2021.
[ click on image to enlarge ]
Note that there is some variability from year to year. This indicates that a Blue Ocean Event may well happen earlier than the trend, e.g. in September 2017. The image further shows that there's hardly any buffer left, the buffer is virtually gone!

This buffer used to consume massive amounts of ocean heat that is carried along sea currents into the Arctic Ocean. Once the sea ice is gone, that heat must go somewhere else. A huge amount of energy used to be absorbed by this buffer, i.e. by melting ice and transforming it into water. The energy that used to be absorbed by melting ice is as much as it takes to warm up an equivalent mass of water from zero °C to 80 °C. Much of this heat will then suddenly speed up warming of the water of the Arctic Ocean, rather than going into melting the ice as it did previously. So, the water of the Arctic Ocean will suddenly warm up dramatically. Remember that the Arctic Ocean in many areas is very shallow, in many places it's less than 50 m deep, as discussed in an earlier post.

The Buffer has gone, feedback #14 on the Feedbacks page
The danger is that this extra heat will reach the seafloor and destabilize methane hydrates that are contained in sediments at the bottom of the Arctic Ocean. This could result in huge methane eruptions. It is hard for methane plumes to get broken down in the water, given the abrupt and concentrated nature of such releases and given that the Arctic Ocean is in so many places very shallow. Once that methane enters the atmosphere, it will strongly contribute to further warming of the atmosphere over the Arctic.


In conclusion, disappearance of the sea ice would mean that the buffer has gone. This further increases the danger of huge abrupt releases of methane from the seafloor of the Arctic Ocean. In many respects, the danger is such that we can just count ourselves lucky that such huge releases haven't occurred yet.

In response to this danger, comprehensive and effective action is needed, along multiple lines of action, each implemented in parallel and simultaneously. While local feebates are typically the most effective policies, local communities can each decide what works best for them, provided that agreed targets are met, and such targets will need to be a lot stronger and more comprehensive than the aspirational emission reductions that countries have submitted as part of the Paris Agreement.

The situation is dire and calls for comprehensive and effective action, as described in the Climate Plan.


Above post was also read by David Petraitis as part of the podcast by Wolfgang Werminghausen


Arctic Sea Ice September 2016 - Update

[ click on images to enlarge ]
On September 10, 2016, Arctic sea ice reached the second lowest extent measured by satellites since 1979, as the image on the right shows. Arctic sea ice took over second-lowest position with an extent of 4.137 million square km. This was 17,000 square km lower than the 2007 minimum, which was 4.154 million square km on September 18, 2007, according to NSIDC data.

Also note the purple line for 2010 on this image. In early September 2010, some people thought a low was reached (on September 12, 2010), but then a much lower extent was reached later (on September 21, 2010).

As the image below shows (screenshot from the Japan Aerospace Exploration Agency), 2016 Arctic sea ice extent (red line) has declined over the past two days.


Arctic sea ice extent may well decline further over the coming days. The image on the right shows a temperature anomaly forecast for September 24, 2016. This gives an idea of the temperature anomalies that can be expected over the Arctic Ocean over the upcoming week. Temperature anomalies over the Arctic as a whole will be above 2 degrees Celsius for almost that entire period.

There is scope for further sea ice decline, for a number of reasons [hat tip to Albert Kallio]:
- high air temperatures over the Arctic Ocean
- warm river water runoff
- high temperatures of the water in the Arctic Ocean
- very thin and fractured sea ice
- increased wave action of the ocean on sea ice
- increased vertical overturning of ocean water
- increased sea ice migration to absorb more heat from water
- increased sea ice transportation to the Atlantic Ocean / melt areas
- decreased snowline and albedo leading to higher insolation
- high and rising levels of greenhouse gases (CO2, CH4, N2O and water vapor) over the Arctic, trapping more heat

The video below shows that high temperatures are forecast over the Arctic Ocean over the upcoming week.


The time-lapse video below is based on NSIDC data and shows the age of sea ice in the Arctic from week to week since 1990, updated through the March 2016 winter maximum. The oldest ice (9 or more years old) is white. Seasonal ice is darkest blue. Old ice drifts out of the Arctic through the Fram Strait (east of Greenland), but in recent years, it has also been melting as it drifts into the southernmost waters of the Beaufort Sea (north of western Canada and Alaska).


The Naval Research Lab animation below show Arctic sea ice thickness over 30 days (up to September 16, 2016, with a forecast added up to September 23, 2016).


The Naval Research Lab sea ice speed and drift animation below over the same period shows that the amount of sea ice that is expected to move into Fram Strait is expected to increase over the next few days.


The image below shows that on September 24, 2016, it was as warm as 5.1°C or 41.1°F at a location where there still is some of the thicker Arctic sea ice left, with the inset showing Arctic sea ice on September 22, 2016.


The image below shows areas with some of the thicker sea ice on September 18, 2016.


The image below shows that sea surface temperatures on September 18, 2016, were much higher than they were in 1981-2000, especially at higher latitudes.


The image below shows September 18, 2016 sea surface temperature anomalies in the Arctic (latitudes 60°N - 90°N) compared to 1961-1990.


The danger is that, as temperatures of the water of the Arctic Ocean keep rising, heat will reach sediments at the bottom of the Arctic Ocean containing methane hydrates that are on the verge of destabilization. A small increase in temperatures could trigger huge abrupt release of methane from the seafloor of the Arctic Ocean.

The image below shows that on September 14, 2016, methane levels at 367 mb were as high as 2697 ppb and global mean methane level was as high as 1865 ppb.

The image below shows wildfires in Russia on September 18, 2016.


The image below shows that on September 18, 2016, these wildfires resulted in carbon monoxide levels as high as 24,309 ppb (top), and carbon dioxide levels as high as 612 ppm (bottom).


The image below shows that, on September 19, 2016, carbon monoxide levels were as high as 38,035 ppb (green circle left) and carbon dioxide levels were as high as 701 ppm (green circle right).


The situation is dire and calls for comprehensive and effective action, as described in the Climate Plan.


Links

 Arctic Sea Ice September 2016
http://arctic-news.blogspot.com/2016/09/arctic-sea-ice-september-2016.html

 Storms over Arctic Ocean
http://arctic-news.blogspot.com/2016/08/storms-over-arctic-ocean.html

 Wildfires in Russia's Far East
http://arctic-news.blogspot.com/2016/08/wildfires-in-russias-far-east.html

 Arctic Sea Ice Getting Terribly Thin
http://arctic-news.blogspot.com/2016/08/arctic-sea-ice-getting-terribly-thin.html

 High Methane Levels Follow Earthquake in Arctic Ocean
http://arctic-news.blogspot.com/2016/07/high-methane-levels-follow-earthquake-in-arctic-ocean.html


Designed with by Way2themes | Distributed by Blogspot Themes